 Watch insteadAutomate Lab Instruments and Electronics Testing with AI | Full Tutorial6:02
Getting started
Your first automation
A complete first pass, from an empty project to measured data. Ten minutes with hardware, five without.
This walkthrough builds a load-regulation sweep: step the input voltage, measure the output at each step, and check every reading against a tolerance. It is the shape of most bench tests, so once you have built it once the rest follow.
Before you start
- Account
- Sign in at app.testflowinc.com. Google, SSO, and email all work.
- Hardware
- Optional for this walkthrough. Steps 1 to 5 work with no instruments plugged in.
- Desktop app
- Needed only for step 6, the run on real instruments. TestFlow offers the download when you first ask for a bench run.
1. Start a project
Type what you want into the box on the home screen and press Enter. That creates the project and opens the builder with your first message already sent. Every project autosaves, so there is nothing to name up front and nothing to save.


2. Add your instruments
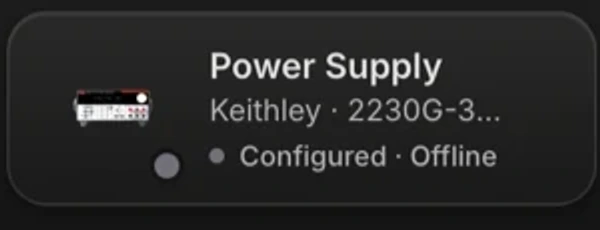
Open the instrument dock at the bottom of the builder and press Add Instruments. Pick the category, then the type, then the manufacturer and model. Fill in the VISA address, or press Scan in the desktop app to list what is actually on the bus.
For this walkthrough you need two: a programmable DC power supply and a multimeter. If you do not have hardware yet, configure the models you expect and continue.
USB0::0x05E6::0x2230::9102345::INSTR
3. Describe the test
Sweep VIN from 1 V to 5 V in 0.5 V steps on the power supply. After a 200 ms settle, measure VOUT on the DMM at each step. VOUT should be 3.3 V within 2%.
Three things make this prompt work: it names the instruments by role, it gives the sweep explicit bounds and a step size, and it states the acceptance limit. See prompting the agent for the pattern.
The agent replies in one line, then builds. Cards appear in the chat as it works: one per thing it changed, each clickable to open the pane it wrote into.
4. Read what it built
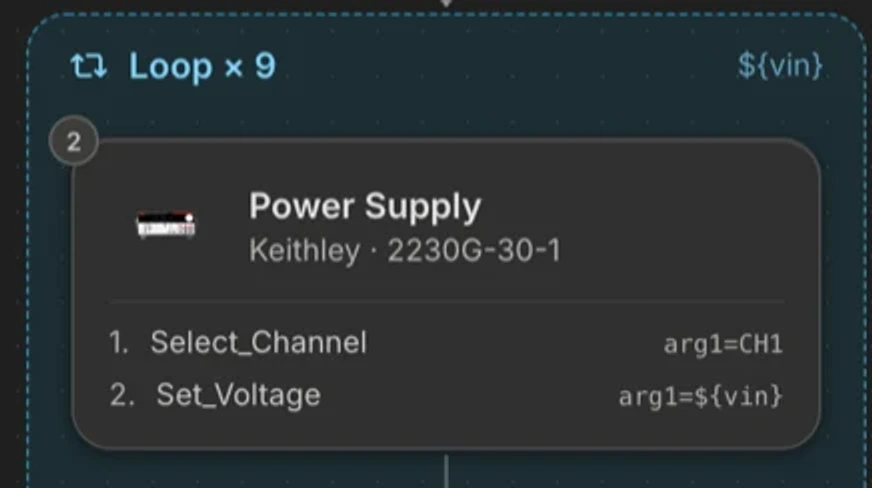
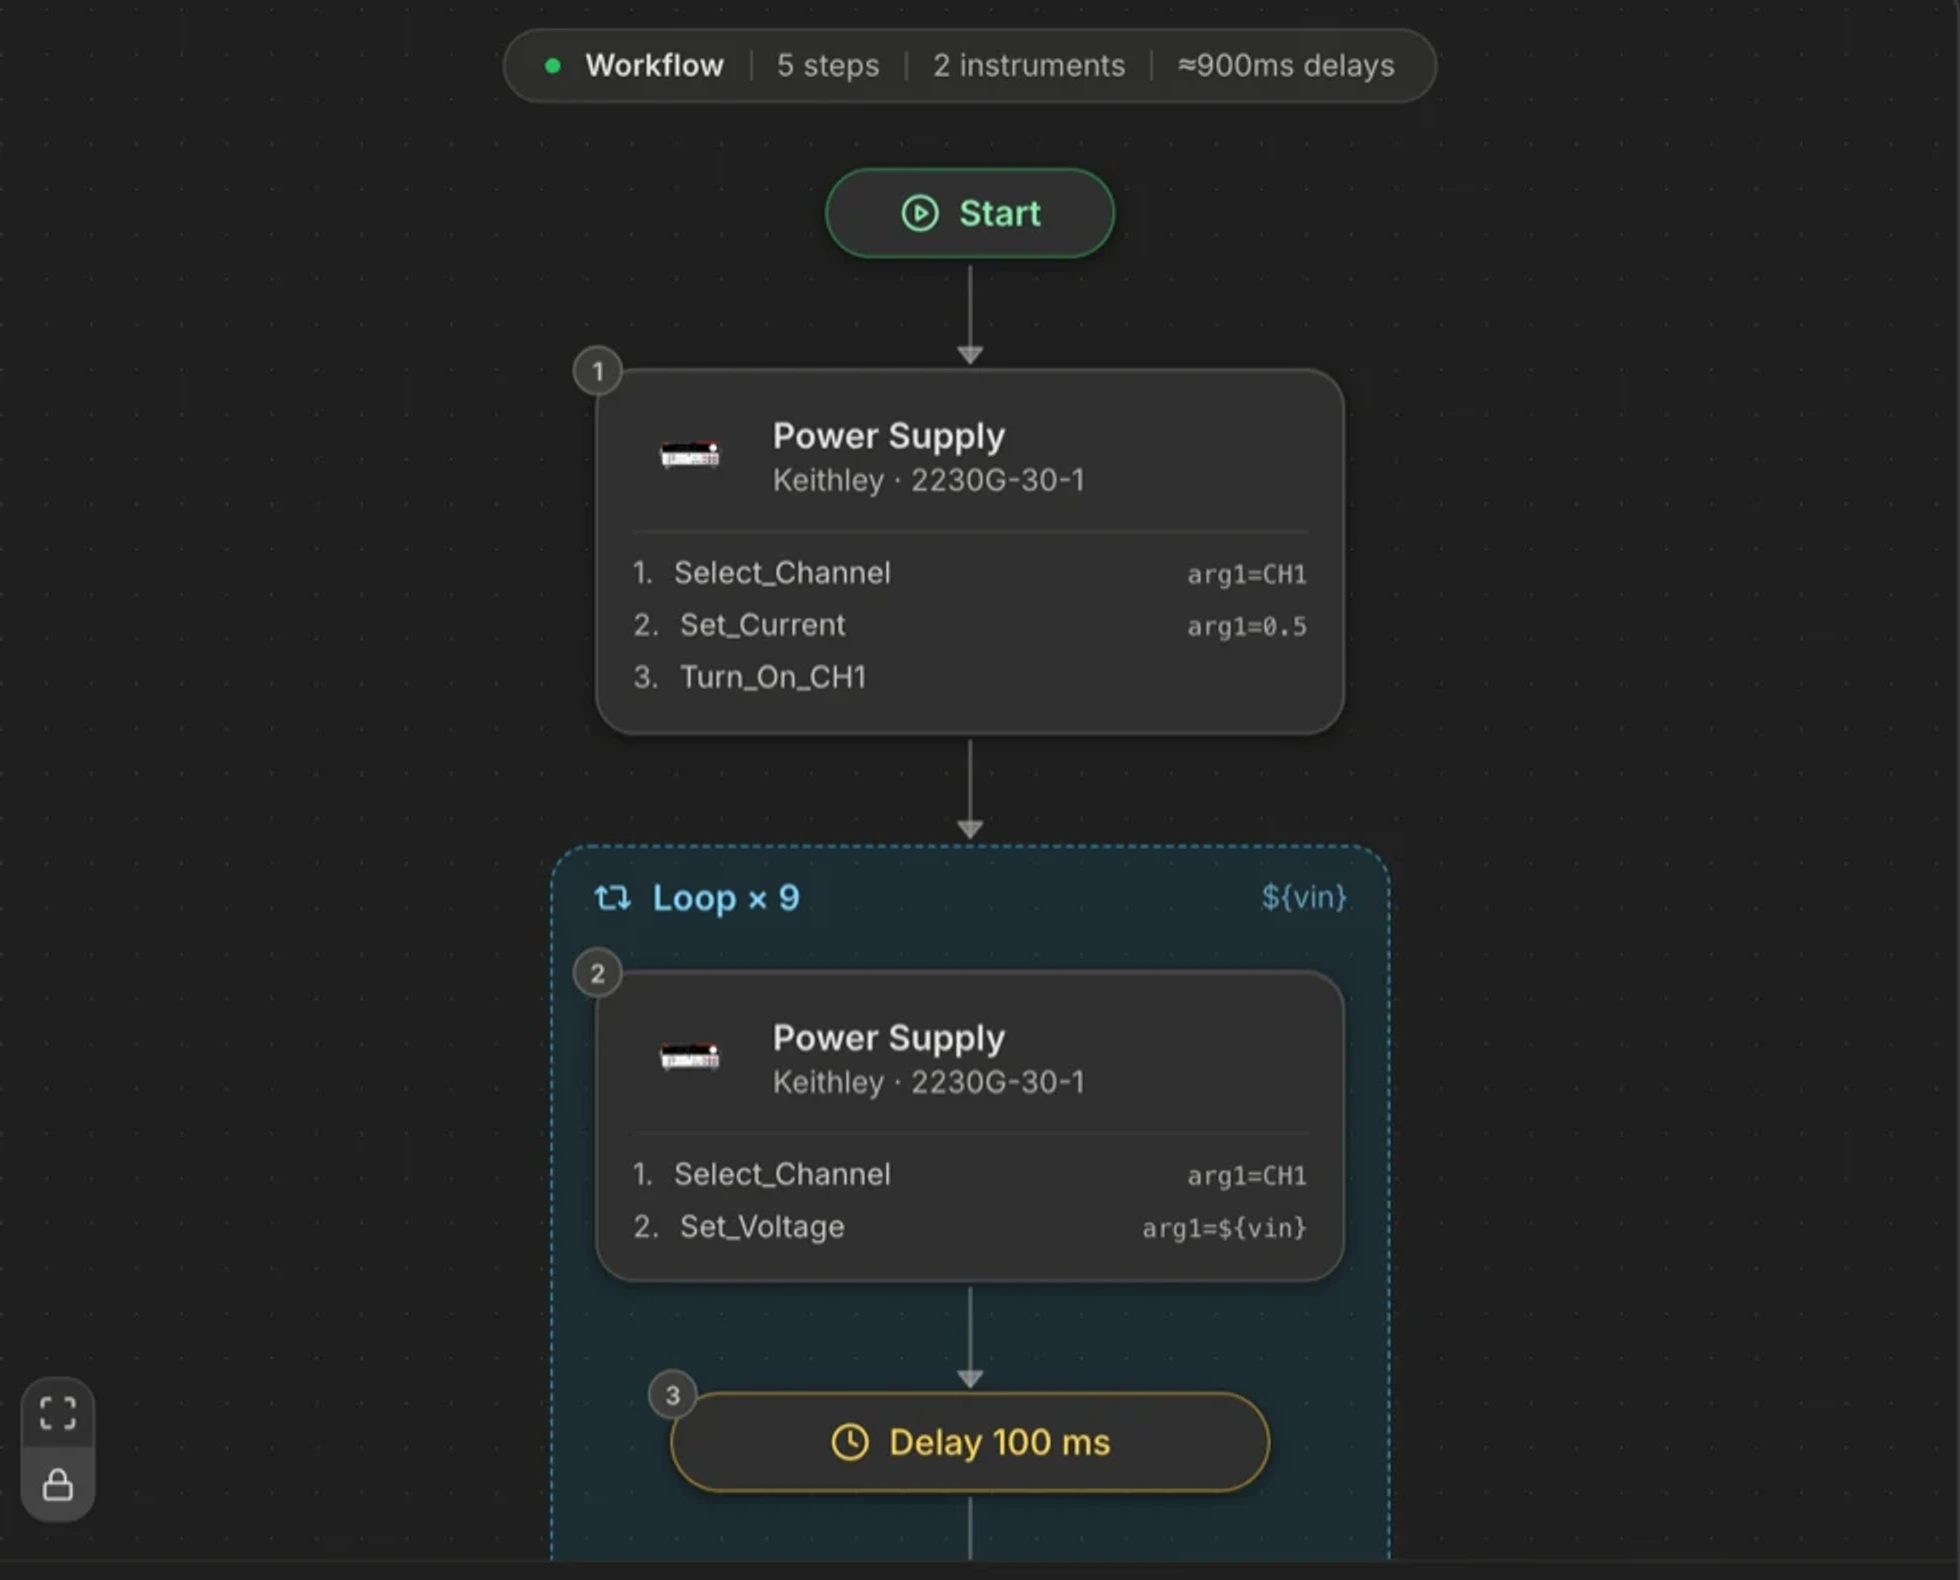
Open Preview. You should see a loop containing four steps: set the supply, wait, measure, and the loop end. The loop carries a variable, vin, sweeping 1 to 5 in 0.5 steps, and the supply's set-point references it.
Click a step to see its instrument, its actions, and its parameters. This is the moment to disagree. If the settle is too short or the DMM is measuring the wrong function, say so in chat, or edit the step directly.
5. Simulate
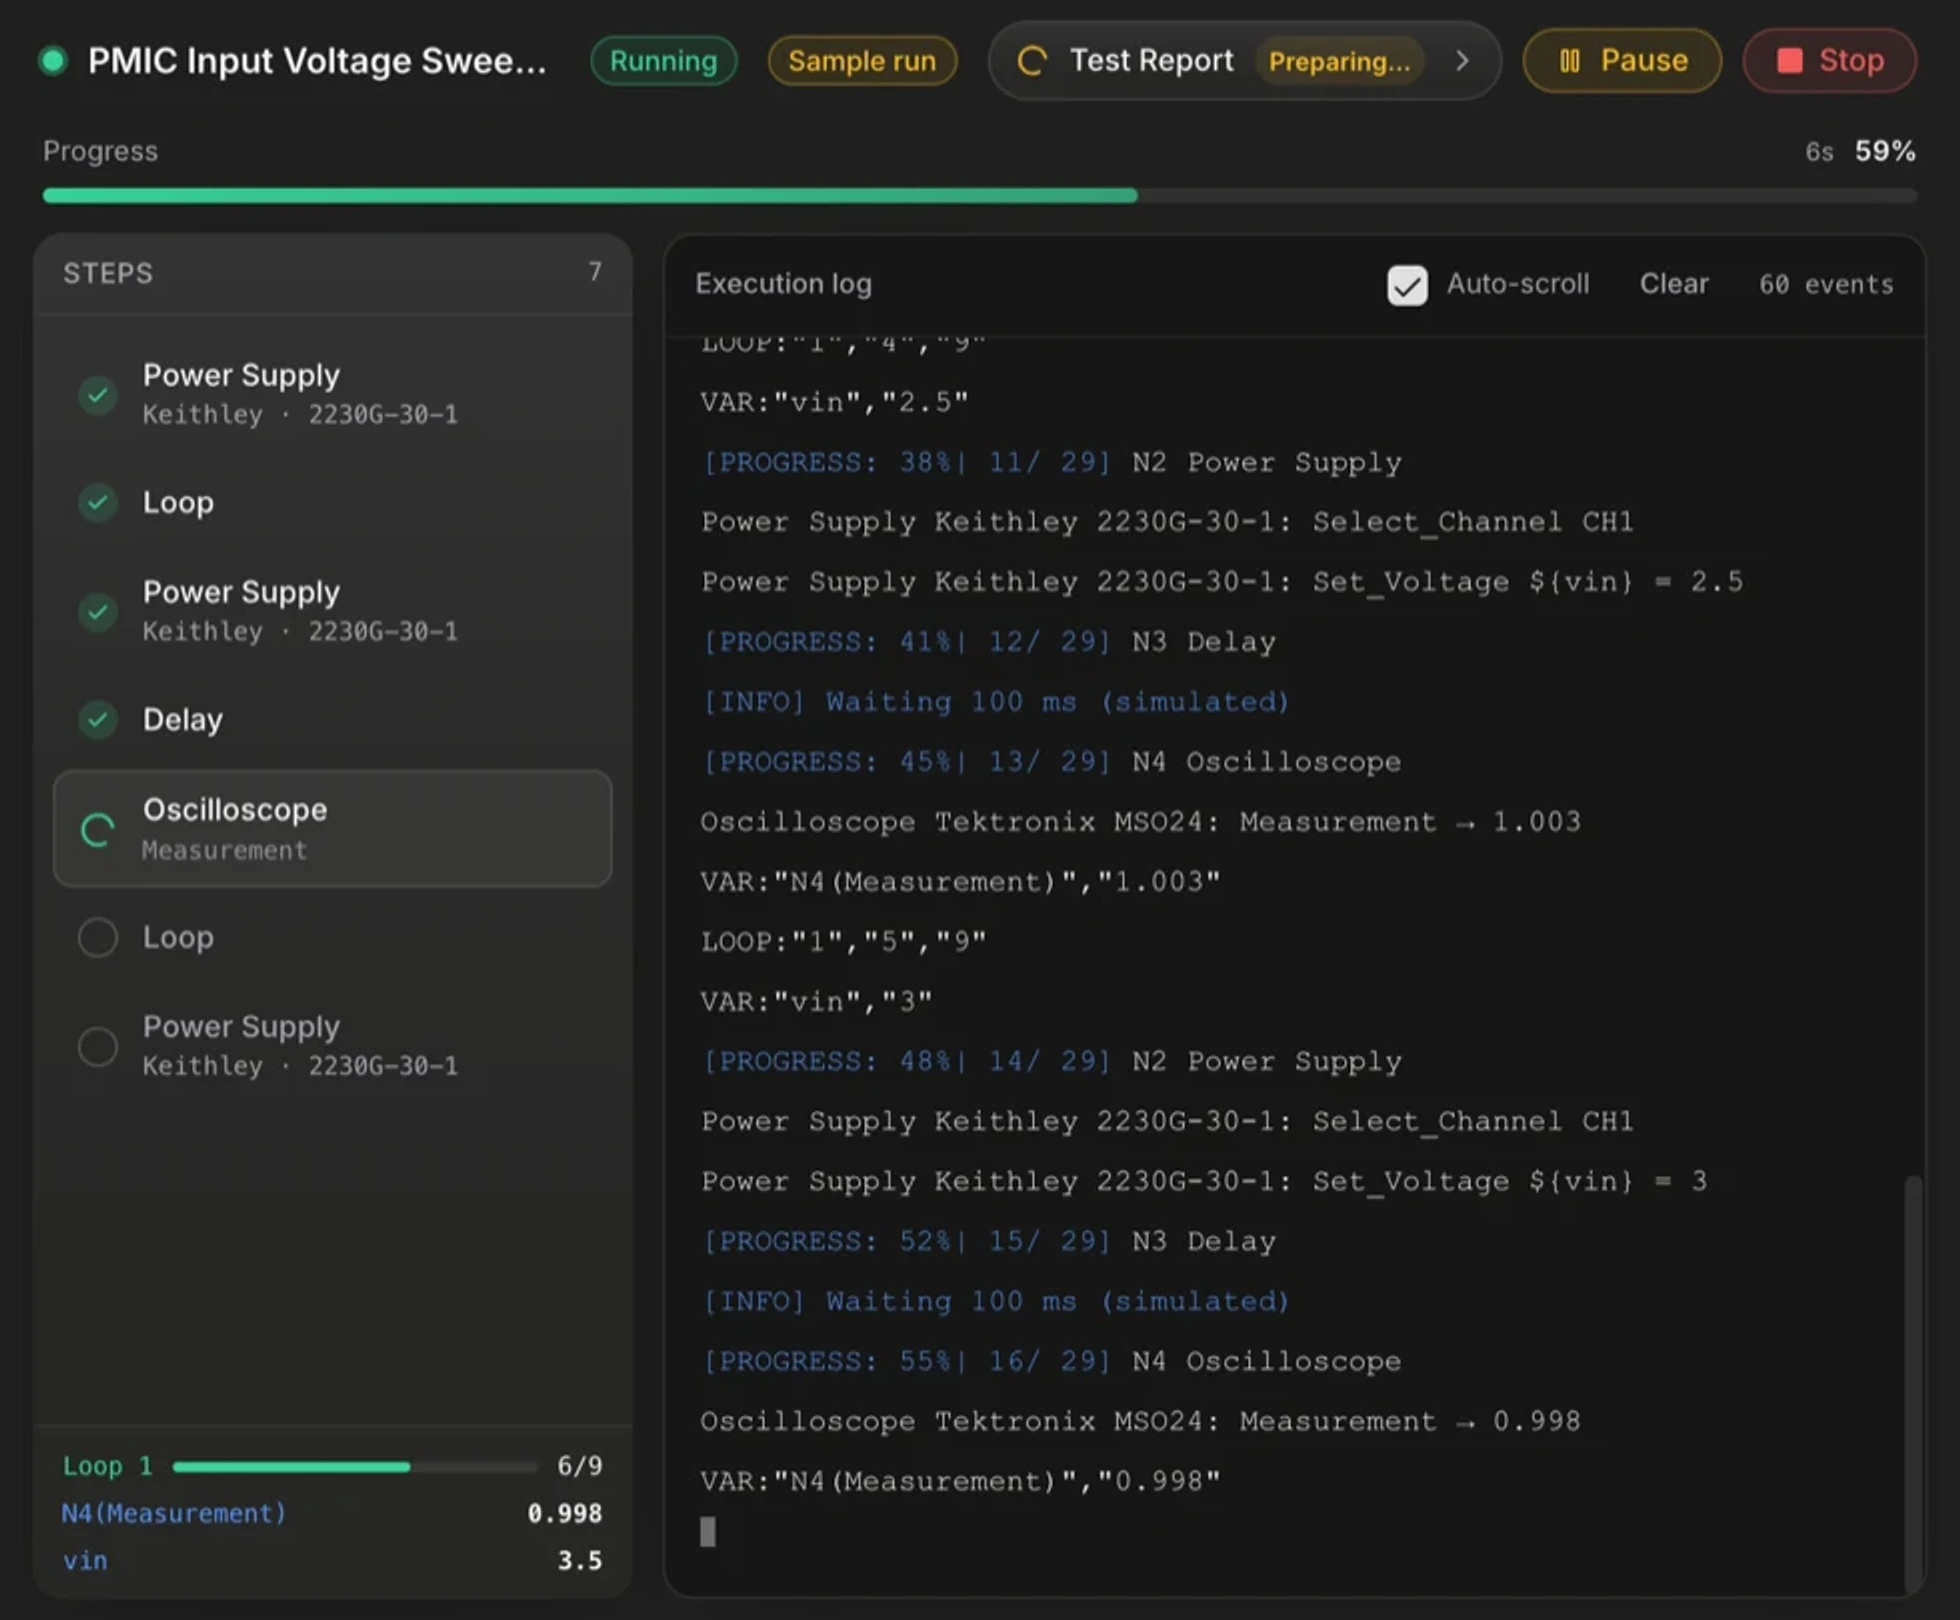
Press the arrow beside Run and choose Simulate. The workflow executes in your browser against synthetic data that follows the real semantics: the loop iterates, the variable sweeps, and each measurement records a value. You get a progress bar, a step rail, a streaming log, and a results table.
6. Run it on the bench
Switch the run mode to Run on my bench. The first time, TestFlow offers the desktop app, which is what actually talks to VISA. Install it, sign in with the same account, reopen the project, and run.
Now the numbers are real. Each measurement is evaluated against your 2% band as it is recorded, so a reading out of spec is flagged at the moment it happens rather than at the end.
7. Take the results with you
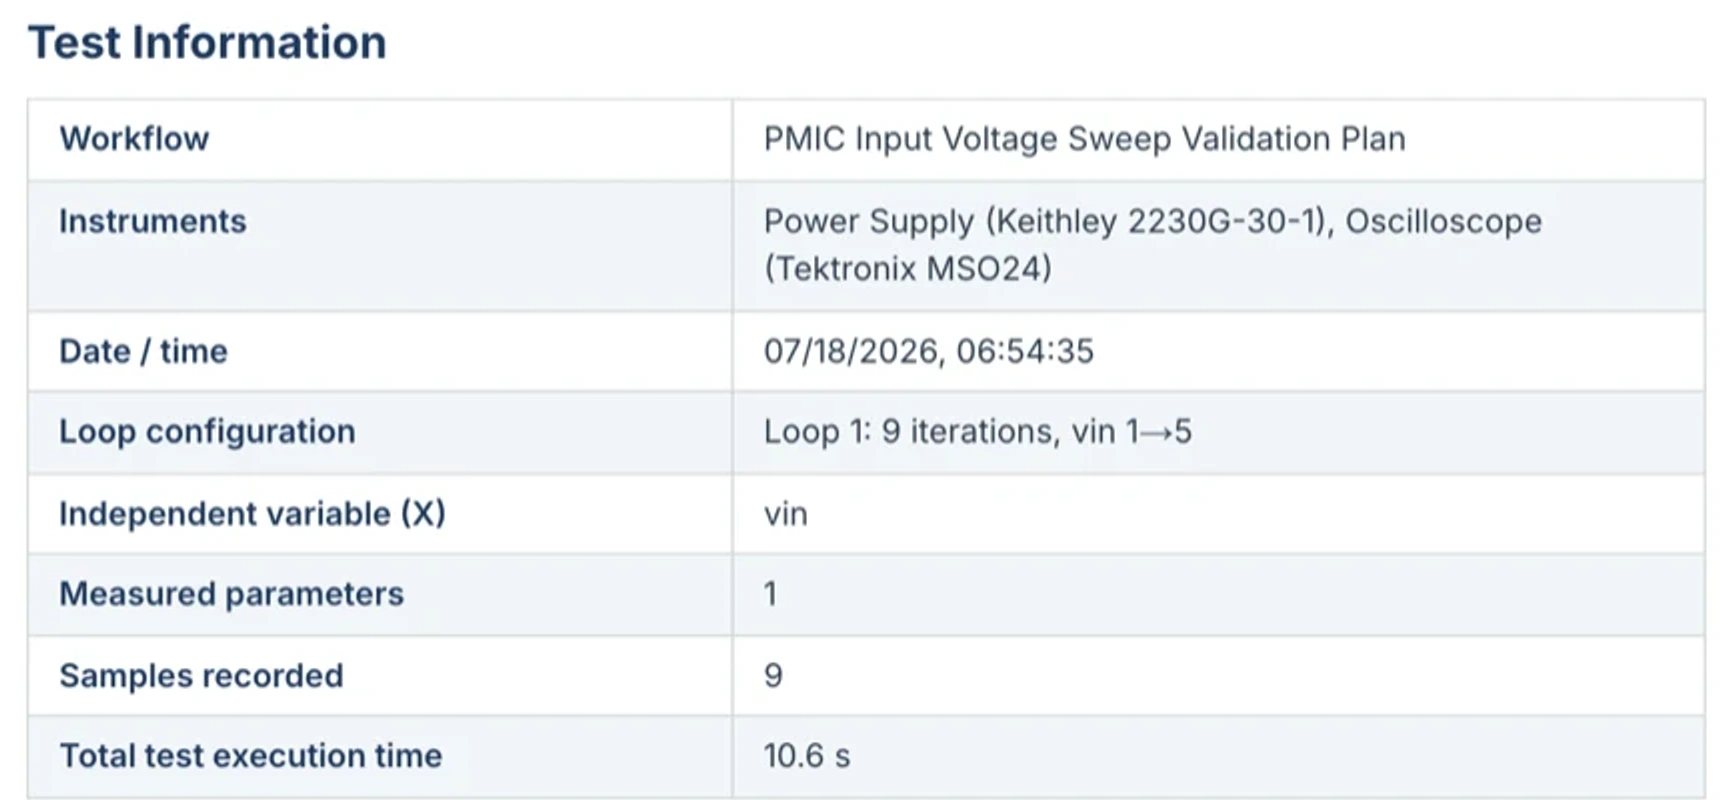
Open Report. It holds the measured columns grouped by step, the limits you stated, the charts, and the verdict. Export it as a Word document for a design history file, as.xlsx for analysis, as Markdown for a ticket, or as JSON for a pipeline.