The builder
Executor
Where tests run. Live progress, a streaming log, measurements as they arrive, and a queue when you have several tests to get through.
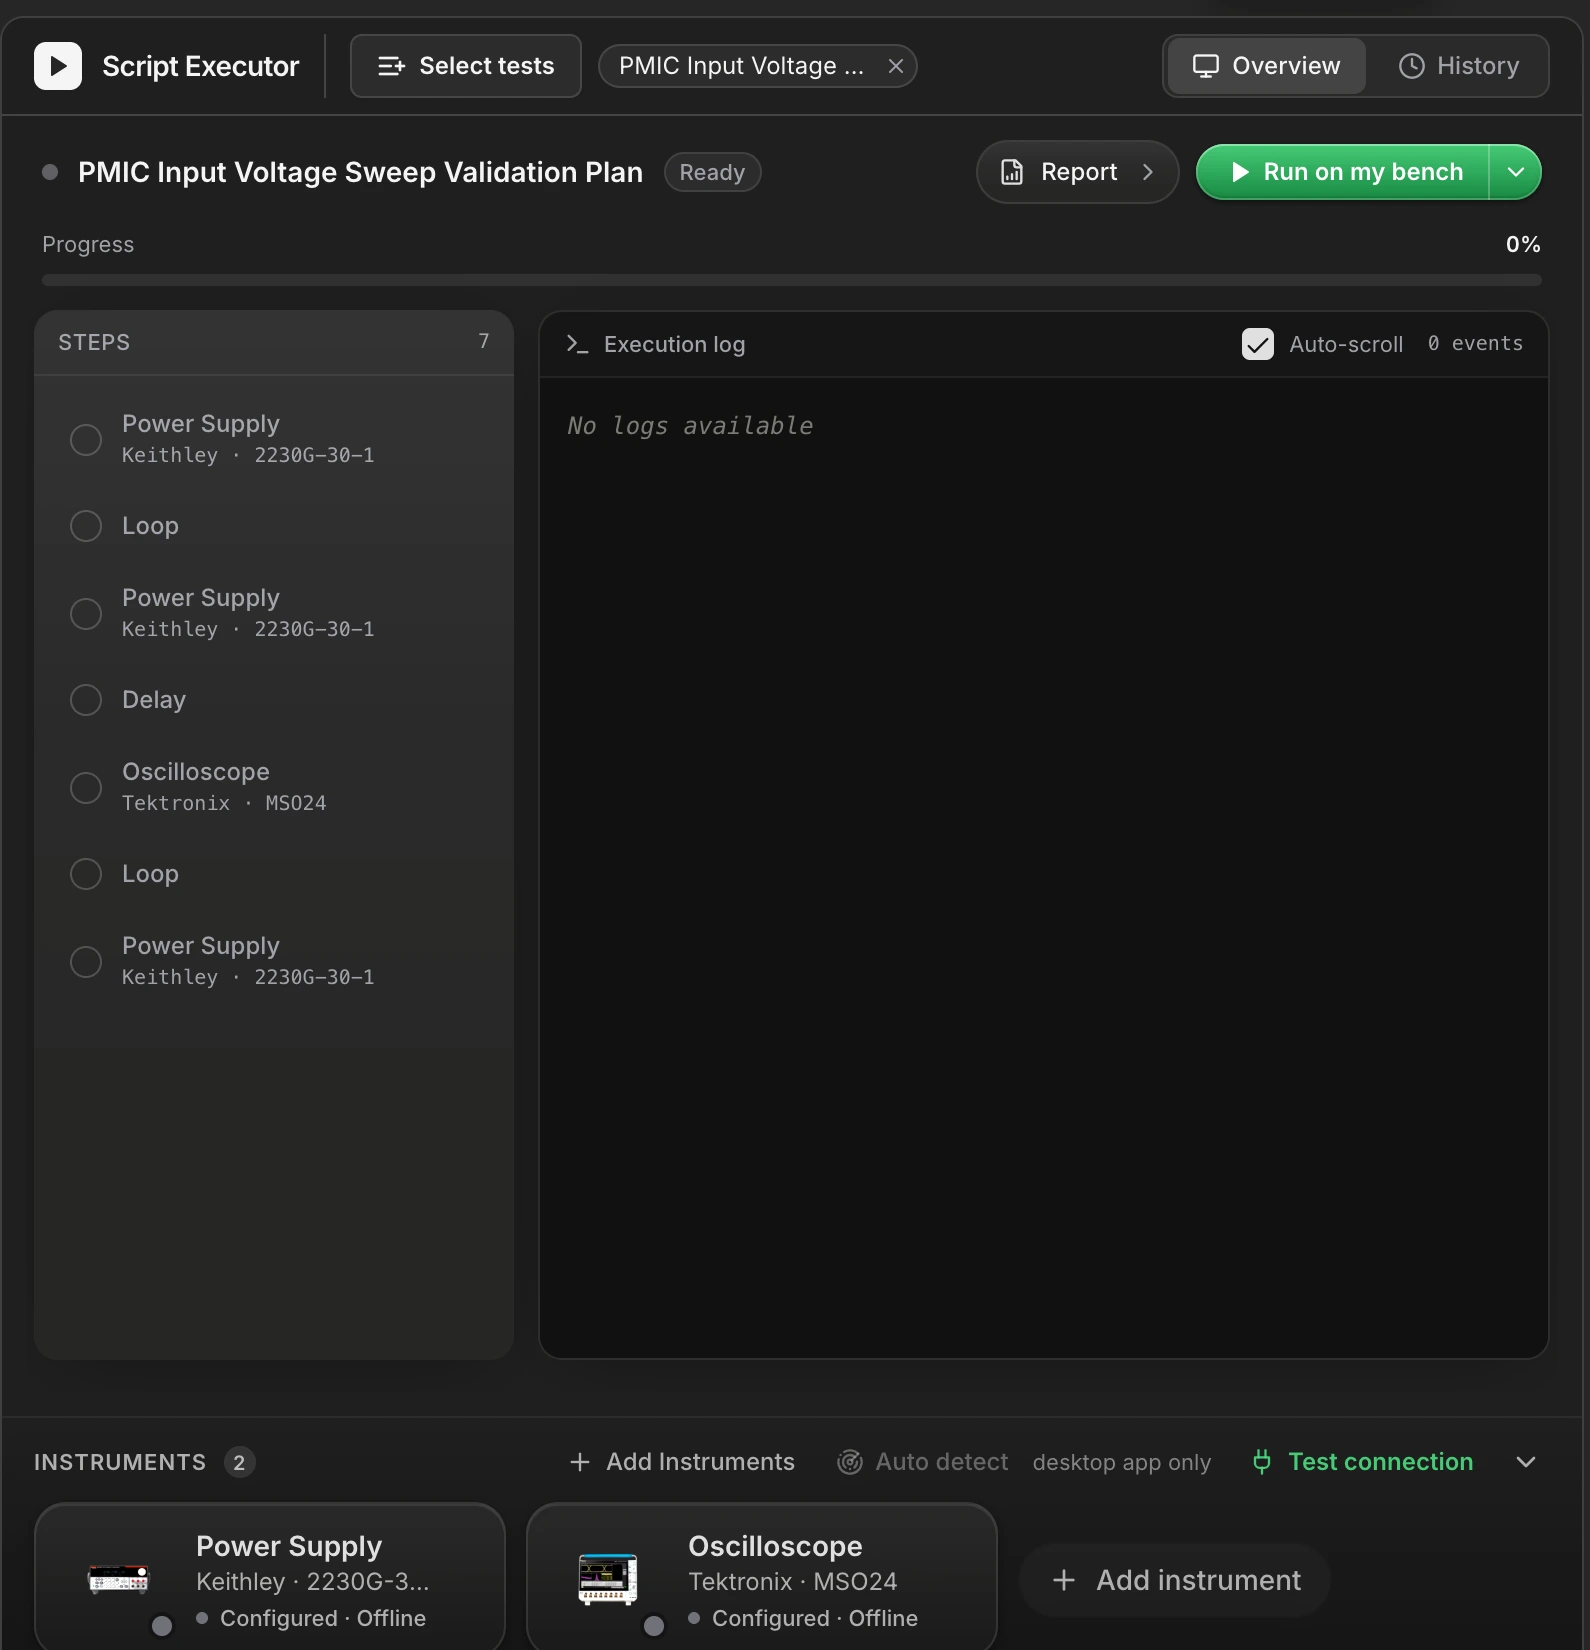
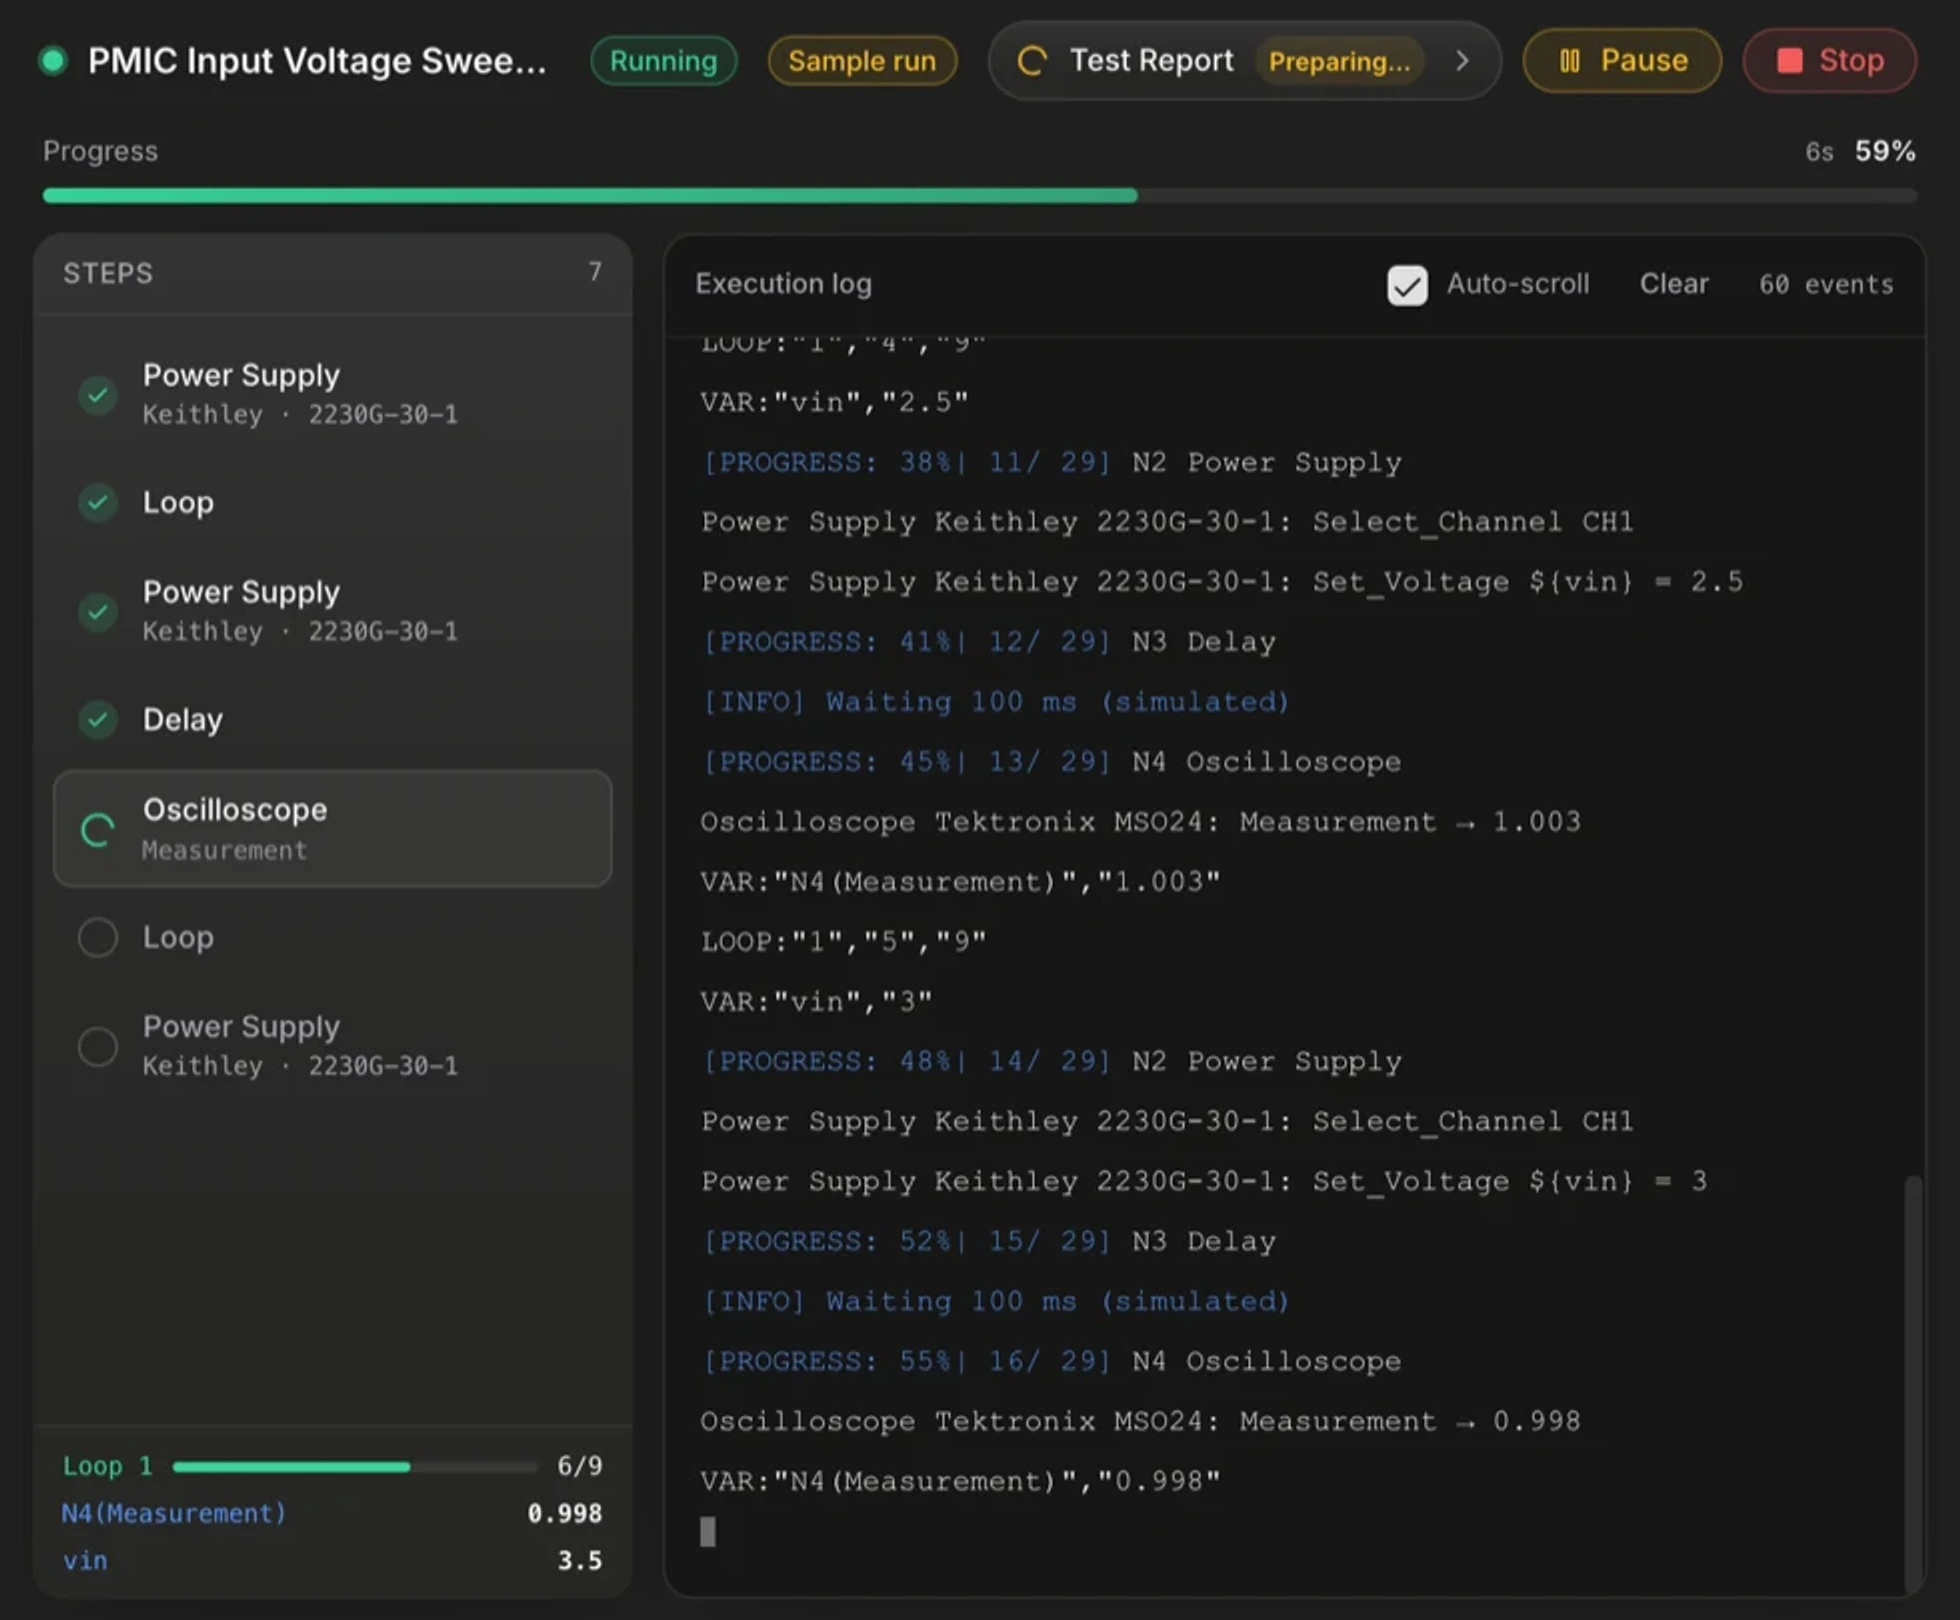 123456
- 1Status. The workflow being run, and a badge for the state it is in.
- 2Progress, driven by the running package itself rather than estimated.
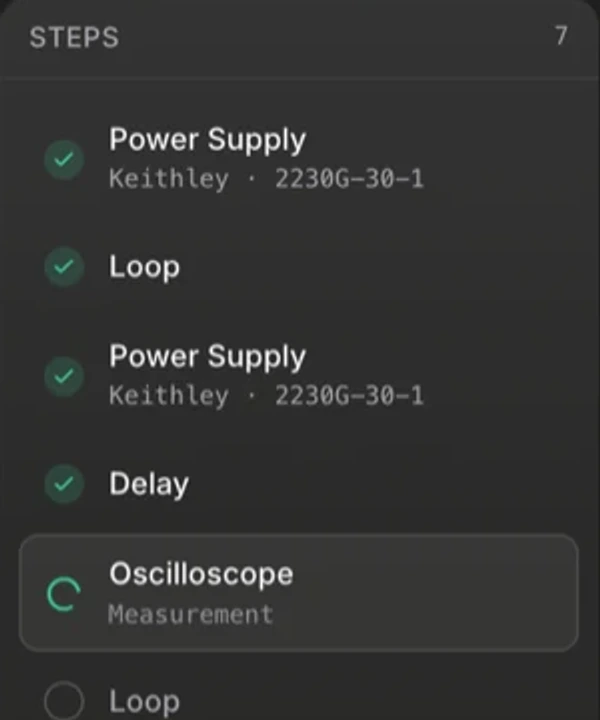
- 3The steps rail. Ticked steps are done, the spinner is the step executing now, and hollow ones are still ahead.
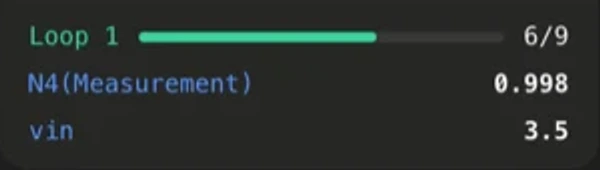
- 4Loop counter and live values. Which iteration, and what each variable and measurement currently reads.
- 5The execution log, streaming. Auto-scroll, a clear, and an event count sit in its header.
- 6Pause and Stop. A stopped run is reported as stopped, never as a failure and never as a pass.
The two run modes
Simulate
No hardware
- Runs in your browser against synthetic data that follows the real workflow semantics.
- Loops iterate, variables sweep, each measurement records a value.
- Proves the sequence is coherent. Proves nothing about your hardware.
Run on my bench
Real instruments, over VISA
- Executes the generated package through the desktop app on your machine.
- Real readings, evaluated against your limits as they are recorded.
- The first time, TestFlow offers the desktop app download.
The split button runs the mode shown; the arrow beside it switches mode. Run in the main toolbar does the same thing and switches you to this pane.
What you see during a run


| Element | Shows | Notes |
|---|---|---|
| Progress | Percentage complete and a status badge. | Driven by the running package, not estimated. |
| Step rail | Which step is executing, and which have completed. | The fast way to see where a run stalled. |
| Action ticker | The specific action in flight. | Useful when one step has many actions. |
| Loop counter | Iteration number and the current variable values. | Confirms the sweep is doing what you asked. |
| Execution log | The run’s output, live. | Capped in the view for performance. The complete log is on disk in Output/. |
| Measurement dashboard | Readings as the results file grows. | Cards per measured column, updating a few times a second. |
| Stop | Ends the run. | A stopped run is reported as stopped, never as a failure and never as a pass. |
Running several tests


Select a test to run opens the queue. Add as many workflows as you want, reorder them, and remove one from the queue with the × on its chip. The run button then shows the count and works through them in order. Queued items are refreshed to their latest saved revision when the run starts, so you are never running yesterday's snapshot.
Opening Executor from a builder session pre-selects the workflow you were just editing, so the common case takes no setup.
Approving generated drivers
If the run would execute an AI-written driver against real hardware for the first time, Executor stops and shows you the code. Approve it to continue. Approval is keyed to the shape of the workflow, so retuning a set-point does not ask again and restructuring the test does.
Importing an existing script
Executor accepts a TestFlow script file dropped onto it, which is how you run something exported from another workspace without rebuilding it.