 Ali Kamaly
NI FlexLogger Alternatives in 2026 (Free & No-Code Options)
FlexLogger is NI's no-code data logging subscription. Here is what it does well, where the NI-hardware assumption bites, and the five alternatives that cover mixed-vendor benches.
NI FlexLogger is a configuration-based data logging application for NI DAQ hardware. You configure sensors with scaling and engineering units, set acquisition rates, watch live data, and log to TDMS, without writing a line of LabVIEW. It is NI's answer to the engineer who wants measurements rather than a programming project.
Two things drive teams to look at alternatives: it is a paid subscription where its predecessor had a free tier, and it assumes your hardware is NI. This post covers what FlexLogger does well, exactly where the hardware assumption bites, and the five realistic alternatives.
What FlexLogger does well
- •Sensor configuration is genuinely good. Thermocouple types, bridge configurations, IEPE accelerometers, RTDs, and strain gauges are handled with the right scaling, excitation, and units in a dialog rather than in code. This is fiddly work and FlexLogger removes almost all of it.
- •Live view before you commit. You see the scaled value in engineering units before starting a run. That catches wiring mistakes in seconds that would otherwise waste an eight-hour soak.
- •TDMS output with metadata attached. Channel names, units, and test properties travel with the data, so DIAdem or
npTDMScan read it meaningfully later. - •No programming. The whole point. A technician can set up a run.
If your bench is NI C Series modules measuring physical sensors, FlexLogger is a good product and this post will probably not change your mind.
Where the hardware assumption bites
FlexLogger is built around NI's DAQ ecosystem. That is fine until your bench looks like most benches:
- •A Keysight or Rigol bench power supply providing the stimulus
- •A Keysight DMM taking the precision measurement
- •A Tektronix oscilloscope capturing transients
- •An electronic load sinking current
- •And some NI DAQ modules reading temperatures
FlexLogger handles the last item. The other four speak SCPI over USB, LAN, or GPIB, and are not what it is designed to drive. So the run splits: FlexLogger logs temperatures, someone else's software drives the supply, and a human correlates timestamps afterwards in Excel.
That correlation step is where the day goes.
What it costs
FlexLogger is a per-seat annual subscription, quote-based, typically low four figures per seat per year. Add the hardware, and add LabVIEW if you ever need to do something FlexLogger cannot configure.
The specific thing to check in your quote: whether you need the base tier or a higher one for the channel count and module types you actually use. Teams routinely buy a tier above what they need because the quote was scoped generously.
The alternatives
1. Python with nidaqmx and pyVISA
Free, and it covers both halves of the split bench. nidaqmx is NI's own Python API for DAQ hardware, no LabVIEW required. pyVISA covers everything else.
import nidaqmx
from nidaqmx.constants import ThermocoupleType, TemperatureUnits

with nidaqmx.Task() as task:
    task.ai_channels.add_ai_thrmcpl_chan(
        "cDAQ1Mod1/ai0",
        units=TemperatureUnits.DEG_C,
        thermocouple_type=ThermocoupleType.K,
    )
    task.timing.cfg_samp_clk_timing(rate=10, samps_per_chan=100)
    data = task.read(number_of_samples_per_channel=100)
Good for: engineers who can code, and any bench with more than one vendor on it. One script drives the supply, the DMM, and the DAQ, so timestamps are correlated by construction.
Gives up: the no-code property, and all of FlexLogger's sensor-configuration convenience. You will be looking up thermocouple constants yourself.
Verdict: the free answer, with a real skill requirement. See DAQ with Python.
2. TestFlow
Vendor-neutral and no-code, covering the whole bench in one workflow. You add each instrument by manufacturer, model, and VISA address, describe the test in plain English, and the agent generates the automation that sequences all of them together.
Good for: the mixed bench. Supply, DMM, scope, and load driven from one workflow, with the measurements correlated because they come from one run rather than four tools.
Gives up: deep sensor conditioning. TestFlow drives instruments over SCPI. It is not a thermocouple-scaling DAQ front end, and if your job is 200 strain channels, DEWESoft or catman is the right tool.
Verdict: the answer when the problem is that your bench has four vendors and four pieces of software.
3. DEWESoft
Commercial data acquisition software with its own hardware line, though it supports a wide range of third-party devices. Strong on high-channel-count, high-rate physical measurement.
Good for: vibration, acoustics, structural, and automotive measurement where channel counts run into the hundreds and rates into the hundreds of kilohertz.
Gives up: price parity. This is a serious commercial platform and priced like one. It is an upgrade, not a saving.
Verdict: the right call if you have outgrown NI DAQ on the physical measurement side, not if you are trying to cut cost.
4. HBM catman
Similar territory to DEWESoft, strong in strain, load, and structural test, with excellent sensor database support.
Good for: strain-gauge-heavy work and mechanical test labs.
Gives up: general bench instrument control, same as FlexLogger. It is a sensor DAQ tool, not an instrument automation tool.
Verdict: a lateral move unless strain is your primary measurement.
5. Keysight BenchVue
No-code, application-based, and it covers the bench instruments FlexLogger does not: supplies, DMMs, scopes, and loads.
Good for: the exact inverse of FlexLogger's coverage. If your bench is mostly Keysight instruments and only a little DAQ, this is the better half of the split.
Gives up: NI DAQ hardware, and vendor neutrality. Apps are licensed individually. See Keysight BenchVue alternatives.
Verdict: good for Keysight benches, and it demonstrates the problem: each vendor solves its own half.
Comparison table
| FlexLogger | Python | DEWESoft | catman | BenchVue | TestFlow | |
|---|---|---|---|---|---|---|
| Cost | Four figures/seat/yr | Free | Commercial | Commercial | Per app | Free version, then paid |
| No code required | Yes | No | Yes | Yes | Yes | Yes |
| NI DAQ hardware | Yes | Yes | Partial | Partial | No | No |
| Third-party SCPI instruments | Limited | Any | Some | Limited | Some | Any |
| Sensor scaling built in | Excellent | Manual | Excellent | Excellent | N/A | N/A |
| High channel count | Good | Good | Excellent | Excellent | Weak | Moderate |
| Sequencing and limits | Weak | You code it | Moderate | Moderate | Some apps | Yes |
| Report output | TDMS logs | You build it | Yes | Yes | CSV, Excel | PDF and CSV |
How to choose
- 1
Is the measurement physical sensors at high channel count? Stay with a DAQ-first tool. FlexLogger, DEWESoft, or catman.
- 2
Is the bench single-vendor? Use that vendor's software. FlexLogger for NI, BenchVue for Keysight.
- 3
Is the bench mixed, and does the test involve stimulus as well as measurement? That is the case FlexLogger handles worst. Python if you can code, TestFlow if you would rather not.
- 4
Is cost the driver and you have Python skills?
nidaqmxpluspyVISAgives you everything for free, at the cost of build time.
The hidden cost of a split bench
Worth quantifying, because it rarely appears in any budget.
When FlexLogger logs the temperatures and a second tool drives the supply, somebody has to align the two datasets afterwards. That work is real:
- •Clock skew. Two applications, two clocks, and no shared trigger. Aligning by wall-clock timestamp is accurate to perhaps a second, which is fine for a thermal soak and useless for a transient.
- •Manual correlation. Export both, open Excel, align by timestamp, build the combined view. Twenty minutes to an hour per run, every run.
- •Rerun cost. If the correlation reveals a problem, the whole run repeats, because you cannot go back and re-align data that was never synchronised.
- •No single verdict. Pass and fail has to be decided by a human looking at two files, so it is not reproducible and not auditable.
For a team running four characterisation runs a week, an hour of correlation each is roughly five working weeks a year. That is the real comparison against a subscription price, and it is usually larger.
A migration order that does not disrupt production
- 1
Keep FlexLogger for the sensor channels initially. It is good at them and there is no urgency.
- 2
Move the instrument control first, since that is the part FlexLogger never covered and where the split originates.
- 3
Once the instrument side is scripted, add the DAQ channels to the same script with
nidaqmx, so both come from one run with one clock. - 4
Run both paths in parallel for two weeks, comparing the temperature traces. They should agree within the sensor's own accuracy.
- 5
Drop the FlexLogger seat at renewal.
Step 3 is the one that delivers the value. Everything before it is preparation.
Doing sensor channels and instruments in one script
Step 3 above is where the split bench closes. It is worth showing, because "add the DAQ channels to the same script" sounds harder than it is. nidaqmx drives NI hardware directly, with no LabVIEW and no FlexLogger licence, and it coexists with pyVISA in the same process and the same clock.
import time
import nidaqmx
import pyvisa
from nidaqmx.constants import TemperatureUnits, ThermocoupleType

rm = pyvisa.ResourceManager()
psu = rm.open_resource("TCPIP0::192.168.1.44::inst0::INSTR")
psu.write("*RST")

with nidaqmx.Task() as temps:
    temps.ai_channels.add_ai_thrmcpl_chan(
        "cDAQ1Mod1/ai0:3",
        units=TemperatureUnits.DEG_C,
        thermocouple_type=ThermocoupleType.K,
    )

    for v_in in (10.8, 12.0, 13.2):          # low line, nominal, high line
        psu.write(f":SOUR:VOLT {v_in}")
        psu.write(":OUTP ON")
        time.sleep(300)                       # thermal settle
        t = temps.read()                      # 4 thermocouples, one clock
        print(f"{v_in:5.1f} V  ->  " + "  ".join(f"{x:6.2f} C" for x in t))

psu.write(":OUTP OFF")
One process, one timeline, one file. No timestamp alignment afterwards, because there was never a second clock. That is the whole hidden cost from the section above, removed by about fifteen lines.
The sensor scaling FlexLogger gives you for free is the add_ai_thrmcpl_chan call and its siblings for bridges, RTDs, and IEPE accelerometers. It is configuration rather than maths, which is the part people expect to be hard and is not. See DAQ with Python for the full channel-type list and pyVISA tutorial for the instrument half.
What FlexLogger genuinely does better
Being fair about this matters, because the decision goes wrong in both directions.
| Capability | Why FlexLogger wins |
|---|---|
| Sensor configuration | Dropdown per channel type, with excitation, cold-junction, and shunt calibration handled |
| Channel count | Comfortable at 100+ channels where a hand-rolled script gets unwieldy |
| Live view during acquisition | Built in, and genuinely good for spotting a detached thermocouple |
| Synchronised DAQ sampling | Hardware-timed across modules, not software-timed in a loop |
| Time to first reading | Minutes, with nobody writing code |
| Metadata and test properties | Structured, attached to the TDMS output |
If the job is 64 thermocouples on a hardware-timed task with someone watching the traces, FlexLogger earns its subscription and a Python rebuild is a step backwards. The case against it is not capability, it is that most benches are not that job: they are eight channels plus a supply plus a load, and the instrument half is where FlexLogger stops.
Common mistakes
- •Buying FlexLogger to control instruments. It logs sensor channels. Third-party SCPI instrument control is not what it is for, and the gap is where the split bench comes from.
- •Comparing subscription price against zero. The Python route costs build time and maintenance. Count it honestly, then compare against the correlation hours from the split bench, which are also real.
- •Software-timing what should be hardware-timed. A
time.sleep()loop is fine at 1 Hz and wrong at 1 kHz. If sample timing matters, use the DAQ task's own clock, not the OS. - •Rebuilding the live view. If watching traces during acquisition is a real daily need, that is a genuine reason to keep the seat.
- •Ignoring the report. FlexLogger writes TDMS logs, not documents. Whatever route you take, decide early how a run becomes something you can hand to a customer. See automated test report generation.
- •Migrating the sensor channels first. They are the part FlexLogger does well. Move the instrument control first, where the pain actually is.
Related reading
- •NI FlexLogger explained, the product overview
- •NI SignalExpress alternatives, the discontinued predecessor
- •DAQ with Python, the free code-first route
- •Keysight BenchVue alternatives, the other vendor's half
- •What is DAQ, if you are still scoping the requirement
- •pyVISA tutorial, the instrument half of the same script
- •NI software licensing costs, the full NI stack priced
- •Data acquisition software compared, the wider landscape
- •Best data acquisition system, if the hardware is also in scope
- •Automated test report generation, turning logs into documents
- •LabVIEW alternatives, if the whole NI stack is under review
- •Free instrument control software, the zero-cost options in one place
- •NI TestStand alternatives, the sequencing line item on the same bill
Where TestFlow fits
FlexLogger's premise is that configuration beats programming for data logging. TestFlow agrees with the premise and removes the hardware restriction, because most benches are not single-vendor.
- 1
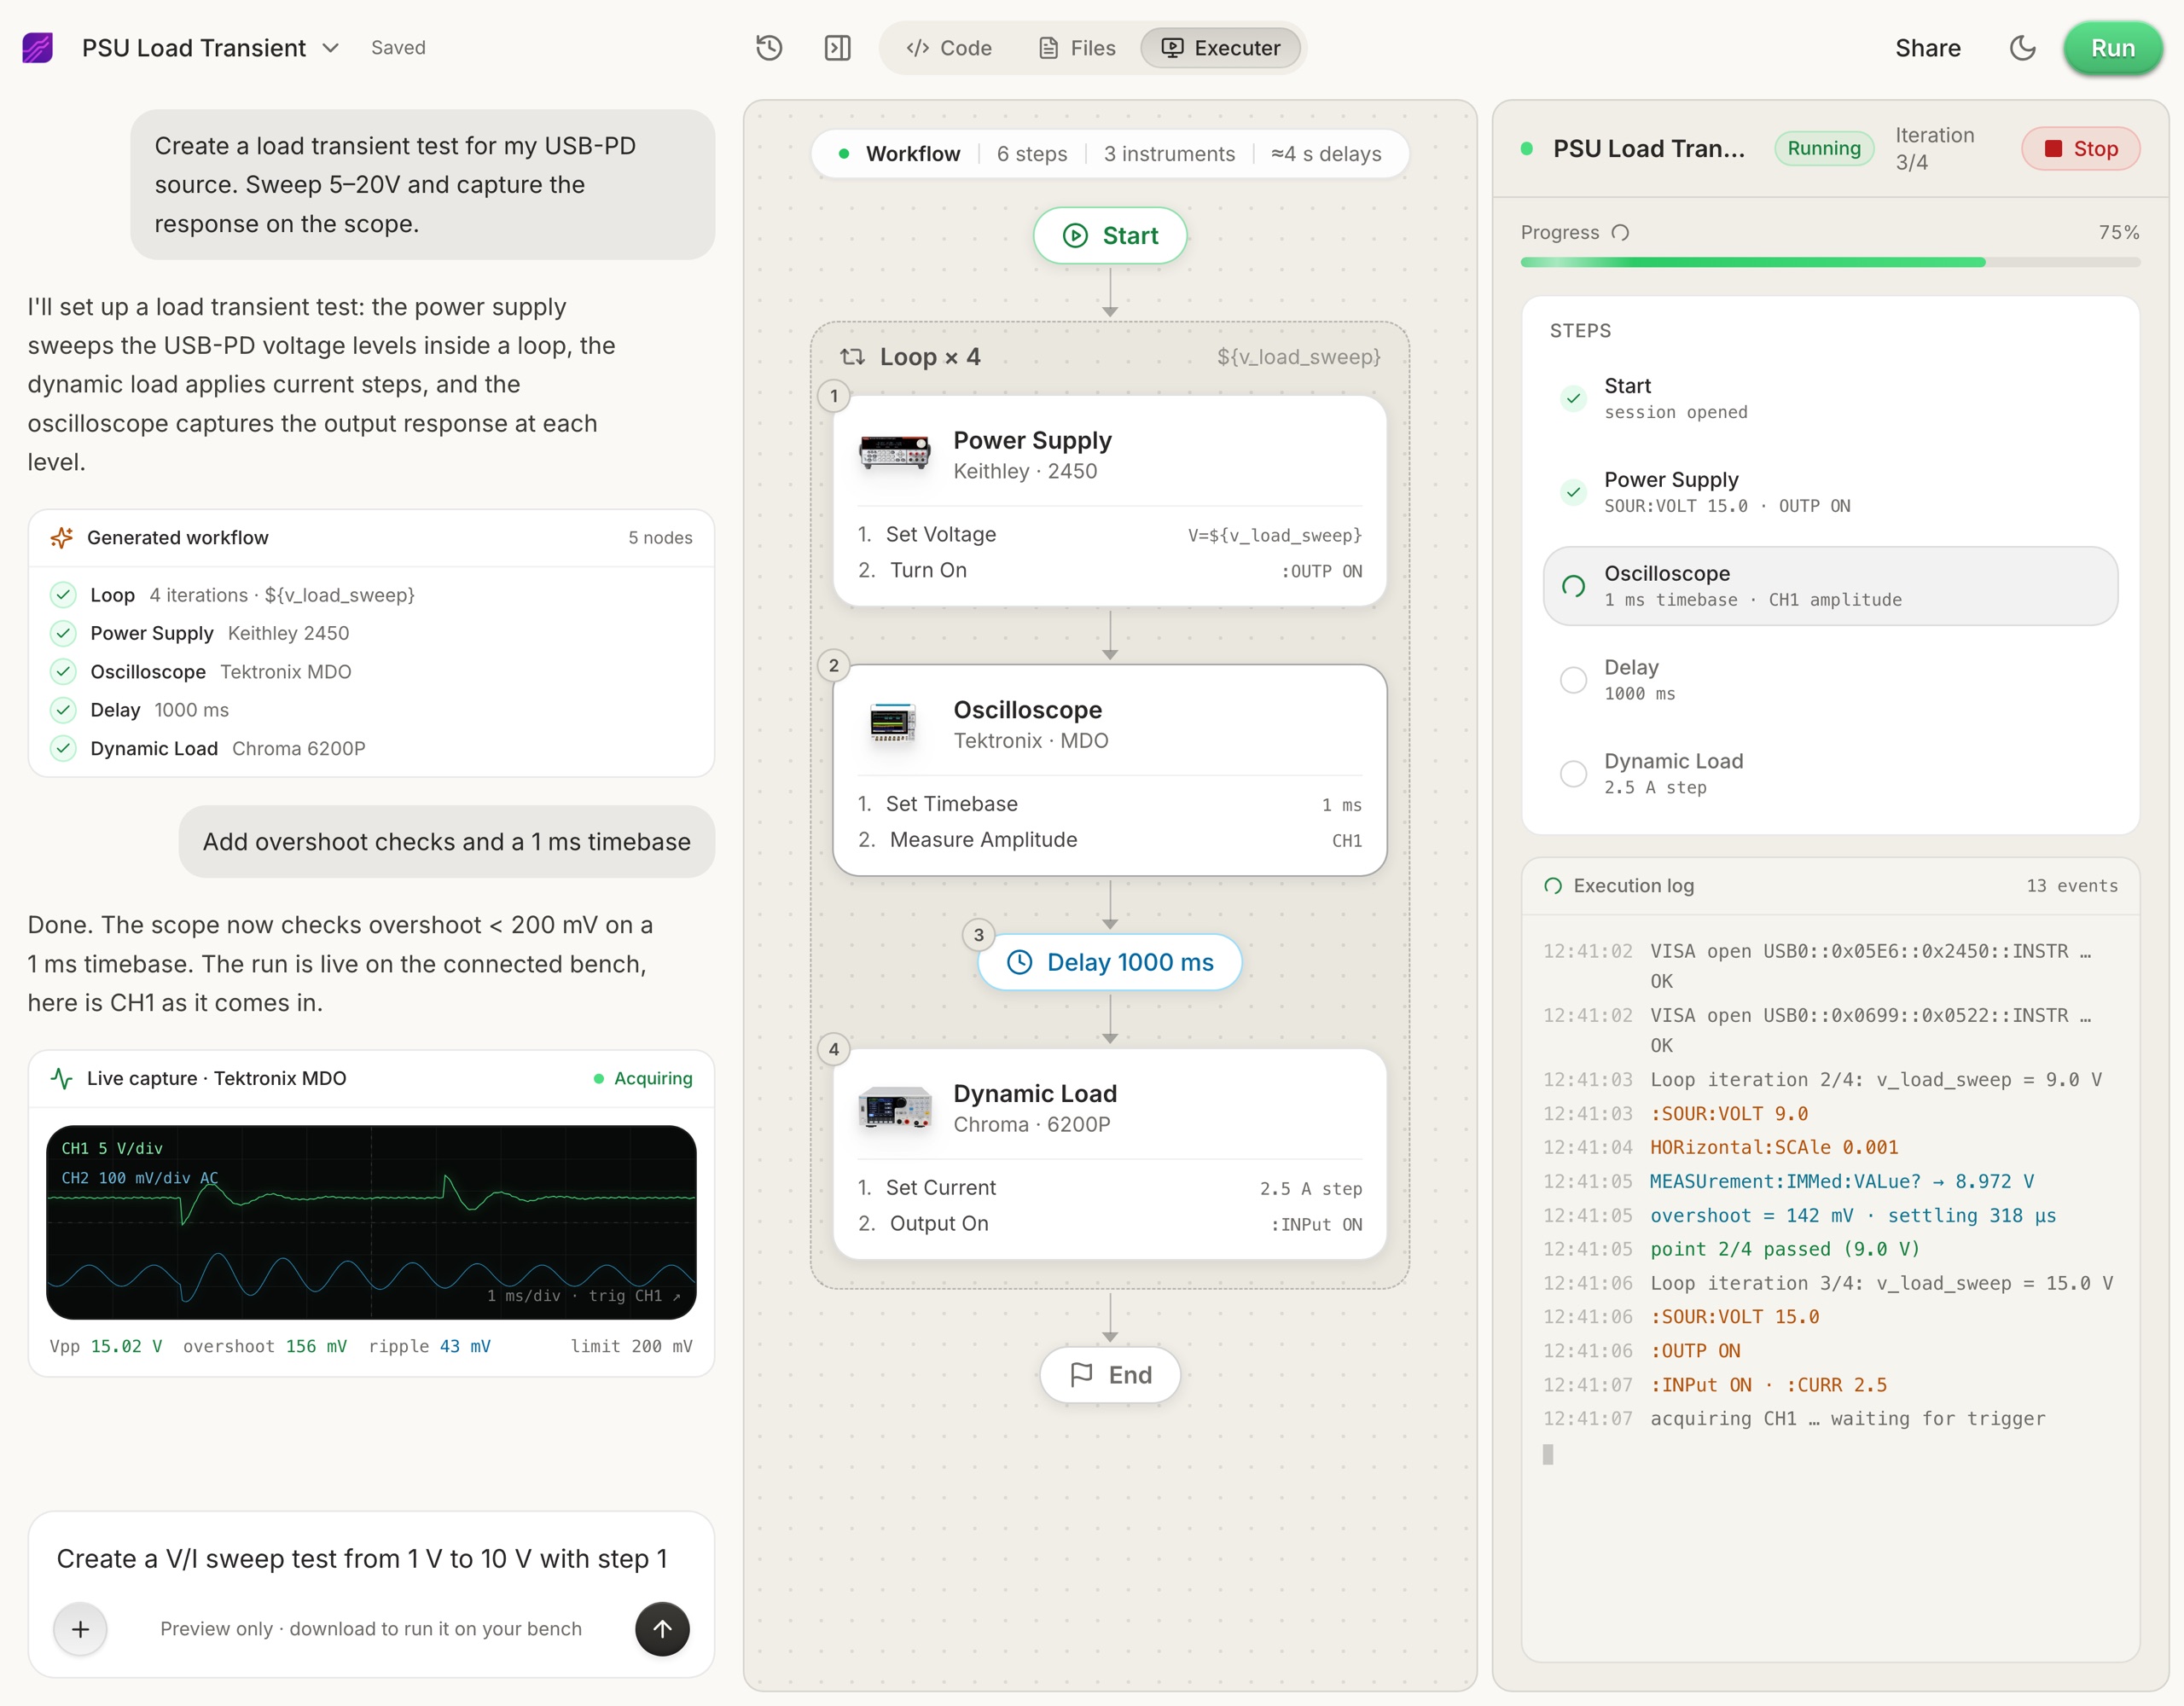
Connect your instruments. Pick the manufacturer and model, paste the VISA address (USB, LAN, GPIB, or serial), and the agent knows what is on your bench. No bench yet? Use a placeholder address, build the full automation, and swap in the real address when you are in the lab.
- 2
Tell the agent what to test, in plain English. For example, "run a VI sweep from 1 to 10 V in 1 V steps at 0.5 A load current," or "suggest the tests for a power-management device."
- 3
The agent builds the complete workflow in seconds. Instrument-aware automation appears on the canvas, with the generated scripts visible in a code panel you can inspect and edit.
- 4
Run it in your lab. Click Run and the status panel streams results step by step, with measured values inline (VOUT = 3.301 V, asserted 3.2 to 3.4 V, PASS). One click exports a structured PDF report, or the raw results as CSV.
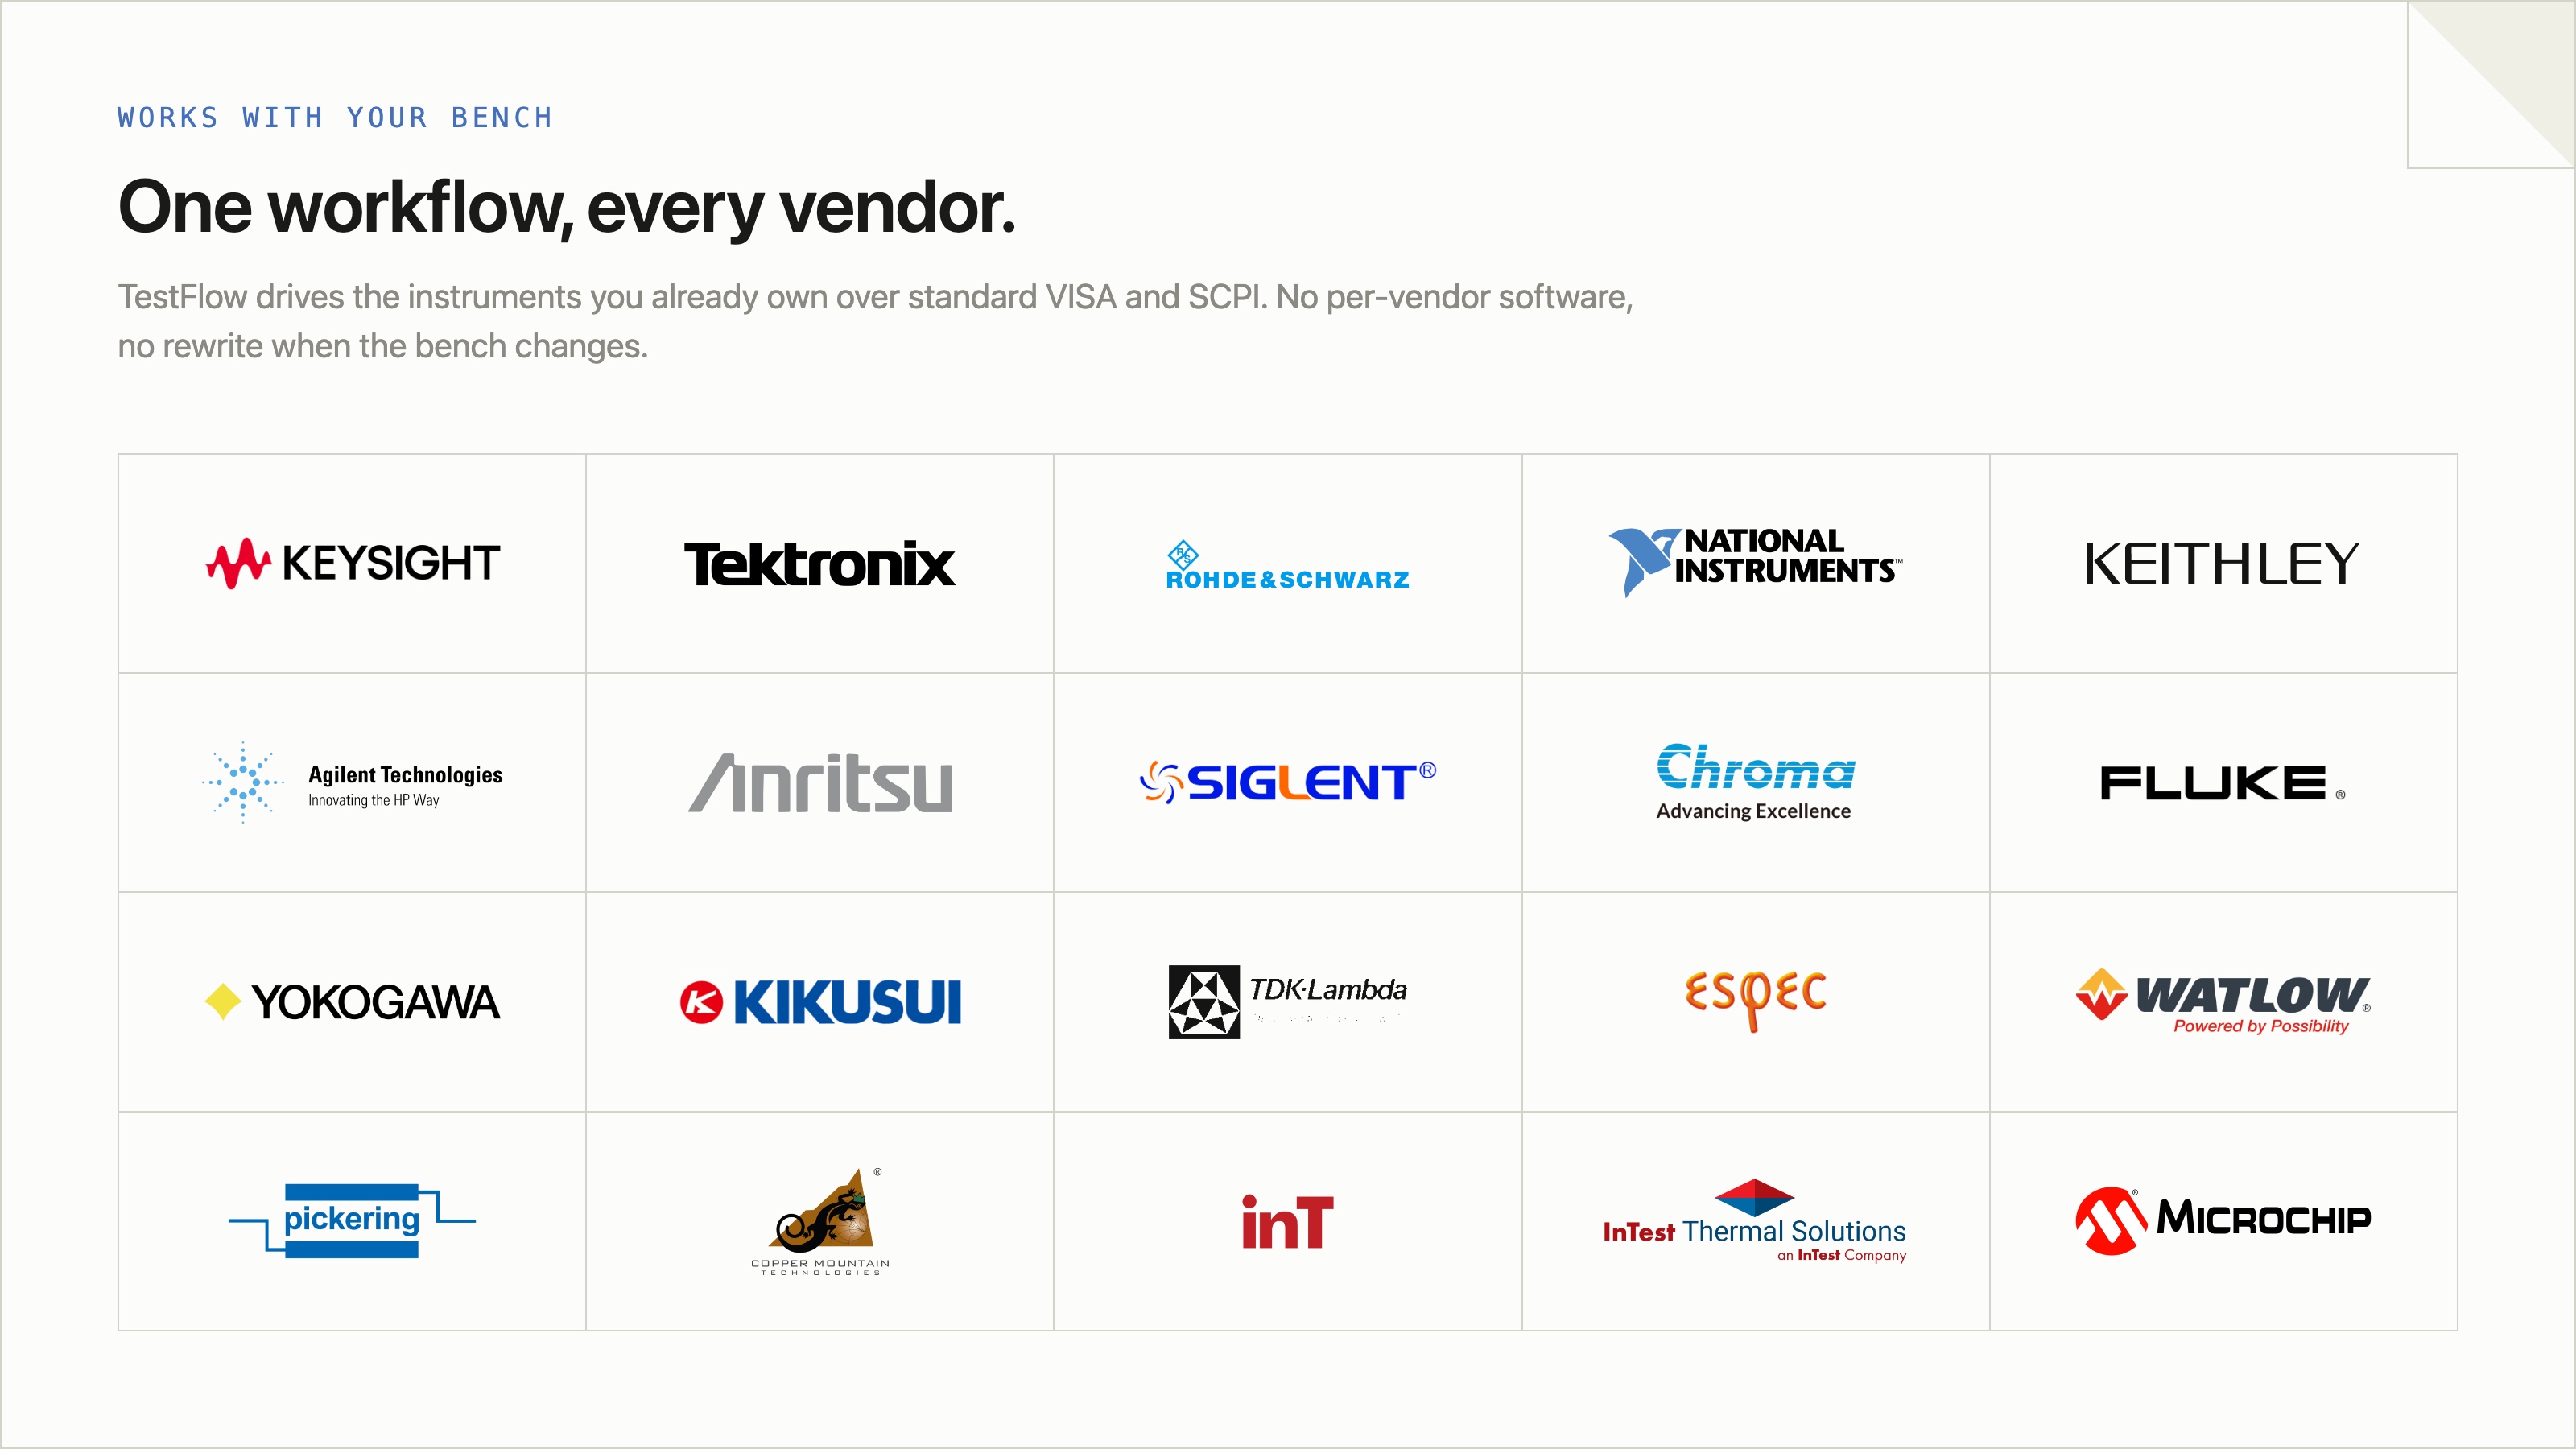
- Vendor-neutral by design. One workflow drives Keysight, Tektronix, Rohde & Schwarz, NI, Rigol, Keithley, Anritsu, and more over standard VISA and SCPI.
- Browser-based and shareable. Workflows live in your workspace, so a sequence built in one lab runs the same way in another.
- Free version to start. Sign in at app.testflowinc.com and build your first workflow today; plans and quotes are on the pricing page.
The step-by-step walkthrough, VISA address formats, and Test Planner prompts are all in the TestFlow product guide.
Frequently asked questions
What is NI FlexLogger used for?
Configuration-based data logging from NI DAQ hardware. You configure sensors with scaling and units, set acquisition rates, view live data, and log to TDMS, all without writing LabVIEW code.
Is NI FlexLogger free?
No. FlexLogger is a paid subscription, licensed per seat. NI offers a time-limited evaluation. This is a change from NI SignalExpress, which it effectively replaced and which had a free tier.
How much does NI FlexLogger cost?
It is sold per seat on annual subscription, typically low four figures per seat per year, with pricing varying by region and tier. It is quote-based, so confirm the number in writing before budgeting.
Does FlexLogger work with non-NI hardware?
Support outside the NI DAQ ecosystem is limited. It is designed around NI C Series and other NI modules with sensor scaling built in. For a mixed-vendor bench with third-party SCPI instruments, it is the wrong tool.
Is there a free alternative to FlexLogger?
Yes. Python with nidaqmx drives NI DAQ hardware for free, and pyVISA covers SCPI instruments. TestFlow has a free version that is vendor-neutral and requires no code.
What is the difference between FlexLogger and LabVIEW?
FlexLogger is configured through dialogs and does logging. LabVIEW is a programming environment that can do anything, including logging, but requires you to build it. FlexLogger trades flexibility for speed of setup.
Ready to automate your lab?
Connect your instruments, describe a test in plain English, and TestFlow builds and runs it in minutes.
Tags
Put it on your bench this week
A new way for testing, from specs to automated sequences, capture clean data, and accelerate your validation cycle.