 Ali Kamaly
How to Automate Test Reports in 2026 (From Excel to Signed PDF)
Moving validation reporting off Excel: the data model that makes reports generatable, a working Python pipeline, what auditors actually require, and how to keep history readable.
Automated test reporting is a data modelling problem, not a document formatting problem. Teams try to automate the document and fail. Teams that first define what a result is, then render it, succeed quickly.
This guide covers why Excel pipelines break, the data model that makes reports generatable, a working Python pipeline with Jinja2 and WeasyPrint, and what traceability actually requires.
Why the Excel pipeline breaks
Nearly every lab starts here: the test writes CSV, an engineer opens a template workbook, pastes the data, and exports a PDF.
It works until it does not, and the failure modes are always the same:
- •Formatting and data are entangled. Changing a column order breaks formulas silently, and nobody notices until a customer queries a number.
- •No meaningful version history. A workbook diff is unreadable, so review is impossible and change control is theatre.
- •It cannot be regenerated. Six months later, nobody can reproduce the exact report from the raw data, because the pasting was manual.
- •The template drifts. Each engineer has a slightly different copy.
- •It does not scale. Twenty units means twenty manual cycles.
The Excel step is not the problem in itself. The problem is that it is the only place where raw numbers become a verdict, and that transformation is not recorded anywhere.
The data model
Define this first. Everything else follows from it.
from dataclasses import dataclass, field
from datetime import datetime

@dataclass
class Measurement:
    name: str
    value: float
    unit: str
    lower_limit: float | None
    upper_limit: float | None
    instrument: str

    @property
    def verdict(self) -> str:
        if self.lower_limit is not None and self.value < self.lower_limit:
            return "FAIL"
        if self.upper_limit is not None and self.value > self.upper_limit:
            return "FAIL"
        return "PASS"

@dataclass
class Instrument:
    model: str
    serial: str
    cal_due: str

@dataclass
class TestRun:
    dut_part_number: str
    dut_serial: str
    test_name: str
    software_version: str
    operator: str
    started: datetime
    instruments: list[Instrument] = field(default_factory=list)
    measurements: list[Measurement] = field(default_factory=list)

    @property
    def verdict(self) -> str:
        return "FAIL" if any(m.verdict == "FAIL" for m in self.measurements) else "PASS"
Three properties make this work:
- •The verdict is computed, never stored. It cannot disagree with the data.
- •Every measurement carries its own limits and the instrument that took it. Traceability is structural rather than added later.
- •It serialises to JSON, so the raw run is archivable and the report can be regenerated at any time.
That last point is the one that matters most in six months.
Rendering
Template in Jinja2, convert with WeasyPrint.
from jinja2 import Environment, FileSystemLoader
from weasyprint import HTML

def render(run: TestRun, template_dir: str, out_pdf: str) -> None:
    env = Environment(loader=FileSystemLoader(template_dir))
    html = env.get_template("report.html.j2").render(run=run, generated=datetime.now())
    HTML(string=html, base_url=template_dir).write_pdf(out_pdf)
The template:
<header>
  <h1>Validation Report</h1>
  <table class="meta">
    <tr><th>Part number</th><td>{{ run.dut_part_number }}</td></tr>
    <tr><th>Serial</th><td>{{ run.dut_serial }}</td></tr>
    <tr><th>Test</th><td>{{ run.test_name }}</td></tr>
    <tr><th>Software</th><td>{{ run.software_version }}</td></tr>
    <tr><th>Started</th><td>{{ run.started.strftime('%Y-%m-%d %H:%M') }}</td></tr>
  </table>
  <p class="verdict {{ run.verdict|lower }}">{{ run.verdict }}</p>
</header>

<h2>Measurements</h2>
<table class="results">
  <thead>
    <tr><th>Measurement</th><th>Value</th><th>Limits</th><th>Instrument</th><th>Verdict</th></tr>
  </thead>
  <tbody>
  {% for m in run.measurements %}
    <tr class="{{ m.verdict|lower }}">
      <td>{{ m.name }}</td>
      <td>{{ "%.6g"|format(m.value) }} {{ m.unit }}</td>
      <td>{{ m.lower_limit }} to {{ m.upper_limit }}</td>
      <td>{{ m.instrument }}</td>
      <td>{{ m.verdict }}</td>
    </tr>
  {% endfor %}
  </tbody>
</table>

<h2>Equipment</h2>
<table class="equipment">
  <thead><tr><th>Model</th><th>Serial</th><th>Calibration due</th></tr></thead>
  <tbody>
  {% for i in run.instruments %}
    <tr><td>{{ i.model }}</td><td>{{ i.serial }}</td><td>{{ i.cal_due }}</td></tr>
  {% endfor %}
  </tbody>
</table>
Page furniture comes from CSS, which WeasyPrint honours properly:
@page {
  size: A4;
  margin: 20mm 15mm;
  @top-right { content: "Validation Report"; font-size: 9pt; color: #666; }
  @bottom-right { content: "Page " counter(page) " of " counter(pages); font-size: 9pt; }
}
tr.fail { background: #fdecea; }
.verdict.fail { color: #b00020; font-weight: 700; }
thead { display: table-header-group; }   /* repeat headers across pages */
display: table-header-group on thead is the one non-obvious line. Without it, a table spanning pages loses its header on every page after the first.
Traceability
If reports go to a customer or an auditor, the following are not optional.
| Requirement | Where it lives |
|---|---|
| Device identity | Part number and serial in the run |
| Test conditions | Recorded per measurement or per run |
| Equipment used | Model, serial, and calibration due date per instrument |
| Software version | Recorded in the run, ideally the git commit |
| Who or what ran it | Operator name or system identifier |
| When | Start timestamp, and duration for long runs |
| Raw data | Archived alongside the PDF, not only summarised |
The calibration due date is the one teams forget. A measurement taken with an out-of-calibration instrument is not a measurement, and discovering that after shipping means re-testing everything since the expiry.
Check it at run time, not at report time:
from datetime import date

for instrument in run.instruments:
    if date.fromisoformat(instrument.cal_due) < date.today():
        raise RuntimeError(
            f"{instrument.model} serial {instrument.serial} calibration expired "
            f"{instrument.cal_due}, refusing to run"
        )
Failing the run is correct. A report that quietly notes an expired calibration will be signed by someone who did not read that line.
Archiving so history stays readable
Write three files per run into one directory:
- •
run.jsonfrom the dataclass. The complete record, machine-readable. - •
report.pdfthe human deliverable. - •
raw/the instrument data, CSV or binary, untouched.
Name directories {part}_{serial}_{timestamp}. Never overwrite. A re-test is a new directory, not a replacement, because "we re-ran it and it passed" is a fact that needs to survive.
With run.json archived, the report can be regenerated with a corrected template years later without re-testing anything. That property is the entire argument for this approach over Excel.
Batch reporting
Once one report generates from data, many is trivial:
import json, glob
from pathlib import Path

runs = [TestRun(**json.loads(Path(p).read_text())) for p in glob.glob("runs/*/run.json")]

passed = [r for r in runs if r.verdict == "PASS"]
print(f"{len(passed)}/{len(runs)} passed, yield {100*len(passed)/len(runs):.1f}%")

render_summary(runs, "batch_summary.pdf")
Yield summaries, trend charts across serial numbers, and per-parameter distributions all become queries over a list of dataclasses rather than a spreadsheet exercise. This is the point at which reporting stops being overhead and starts telling you something about the product.
Adding plots to a generated report
Numbers in a table prove a verdict. A plot is what an engineer actually reads. Embedding one is straightforward if you render it to a base64 data URI, which keeps the report a single self-contained file.
import base64, io
import matplotlib
matplotlib.use("Agg")                     # no display needed on a test station
import matplotlib.pyplot as plt

def plot_to_data_uri(x, y, xlabel: str, ylabel: str, limits=None) -> str:
    fig, ax = plt.subplots(figsize=(7, 3.5))
    ax.plot(x, y, linewidth=1)
    if limits:
        ax.axhline(limits[0], linestyle="--", linewidth=0.8, color="#b00020")
        ax.axhline(limits[1], linestyle="--", linewidth=0.8, color="#b00020")
    ax.set_xlabel(xlabel); ax.set_ylabel(ylabel); ax.grid(alpha=0.3)

    buffer = io.BytesIO()
    fig.savefig(buffer, format="png", dpi=150, bbox_inches="tight")
    plt.close(fig)
    encoded = base64.b64encode(buffer.getvalue()).decode()
    return f"data:image/png;base64,{encoded}"
In the template:
<h2>Regulation over temperature</h2>
<img src="{{ regulation_plot }}" alt="Output voltage against temperature" />
matplotlib.use("Agg") before importing pyplot is the line that matters on a headless test station. Without it, matplotlib tries to find a display and either fails or hangs.
Draw the limits on the plot. A trace with the pass band marked is read correctly in two seconds. The same trace without them requires the reader to cross-reference the table, and they will not.
Regenerating historical reports
The property that justifies this whole approach: with run.json archived, a report can be rebuilt at any time.
import json, glob
from pathlib import Path

for path in glob.glob("archive/**/run.json", recursive=True):
    run = TestRun(**json.loads(Path(path).read_text()))
    render(run, "templates/v2", Path(path).parent / "report_v2.pdf")
Cases where this matters, all of which happen:
- •A customer requires a different report format for a batch already shipped
- •A limit was wrong, and you need to know which units would have failed under the corrected one
- •A template bug misreported a unit, and every affected report needs reissuing
- •An auditor asks for a summary across two years of runs
None of these are recoverable from a folder of PDFs. All of them are a loop over stored data. The archived JSON is the deliverable that makes the pipeline worth building, and the PDF is a rendering of it.
What the report has to contain to be worth anything
Teams argue about format and skip the contents question. A validation report that a customer, an auditor, or your own engineer in two years can actually use has a fixed minimum.
| Section | Why it is not optional |
|---|---|
| DUT identity | Part number, silicon revision, serial. Without it the report describes nothing |
| Test conditions | Supply, load, temperature, and any conditioning before the measurement |
| Instrument identity | Model and serial per instrument, from *IDN?, not typed in |
| Calibration status | Last cal date per instrument. This is the first thing an auditor checks |
| Limits used | The actual numbers applied, not a reference to a document that has since changed |
| Measured values | With units, and with the raw data reachable |
| Verdict per parameter | Pass or fail, per limit, not one overall pass |
| Software version | Which version of the sequence produced this |
| Timestamp and operator | When, and who or what ran it |
The two that get missed most often are calibration status and the software version. Both are one line of code to capture at run time and both are impossible to reconstruct later. Pull instrument identity straight from the instrument:
def instrument_record(inst):
    vendor, model, serial, firmware = inst.query("*IDN?").strip().split(",")
    return {"vendor": vendor, "model": model, "serial": serial, "firmware": firmware}
Typing the model into a config file means the report says what someone believed was on the bench. Querying it means the report says what was actually there.
Choosing the output format
The format argument resolves quickly once you name the reader.
| Reader | Format | Why |
|---|---|---|
| A customer signing off | Fixed layout, archivable, unambiguous | |
| Your own engineer next week | HTML | Interactive plots, links to raw data |
| Another program | JSON or Parquet | Machine-readable, schema-checked |
| A regulator or auditor | PDF, plus the raw data alongside | Both the document and the evidence |
| A dashboard | Database rows | Query across runs, not one at a time |
The right answer for most labs is to store structured data as the source of truth and render whichever document a given reader needs. That is why the data model section above comes before the rendering section: getting that order backwards is what produces a pile of PDFs that cannot be queried and a spreadsheet nobody trusts.
Common mistakes
- •Generating the PDF as the only artefact. A PDF cannot be aggregated. Keep the structured data and render from it.
- •Typing instrument details into a config. Query
*IDN?. See above. - •Omitting the limits from the report. "PASS" without the limit applied is not a result, it is an assertion.
- •One overall verdict. Per-parameter verdicts are what let someone diagnose a failure without rerunning the test.
- •Storing timestamps without a timezone. Cross-site teams discover this at the worst moment. Use UTC with an explicit offset.
- •Rendering from mutable data. If the report can be regenerated from a source that has since changed, the report is not evidence. Snapshot the inputs.
- •Skipping the archive plan. Decide on day one where reports and raw data live for the retention period, see NI DIAdem alternatives for how the format-portability question plays out.
Related reading
- •NI DIAdem alternatives, the commercial reporting tool this replaces
- •Automate multimeter measurements with Python, producing the data
- •How to automate a VI curve sweep
- •Test sequencer software compared, where results handling is decided
- •Hardware testing best practices
- •Optimizing test coverage, deciding what to report on
- •pyVISA tutorial, the acquisition layer underneath
- •Automate a Keysight power supply with Python, a source of report data
- •LabVIEW to Python migration, where reporting is usually the underestimated step
- •Best test automation software, the wider tool field
- •Data acquisition software compared, the logging layer
- •NI software licensing costs, the cost of the commercial route
- •Free instrument control software, the zero-cost stack
- •SCPI command cheat sheet, capturing instrument state for the record
- •NI TestStand alternatives, the sequencer whose result stream feeds the report
Where TestFlow fits
Every report pipeline on this page exists because test results arrive as loose files. Producing the report from the run removes the pipeline rather than automating it.
- 1
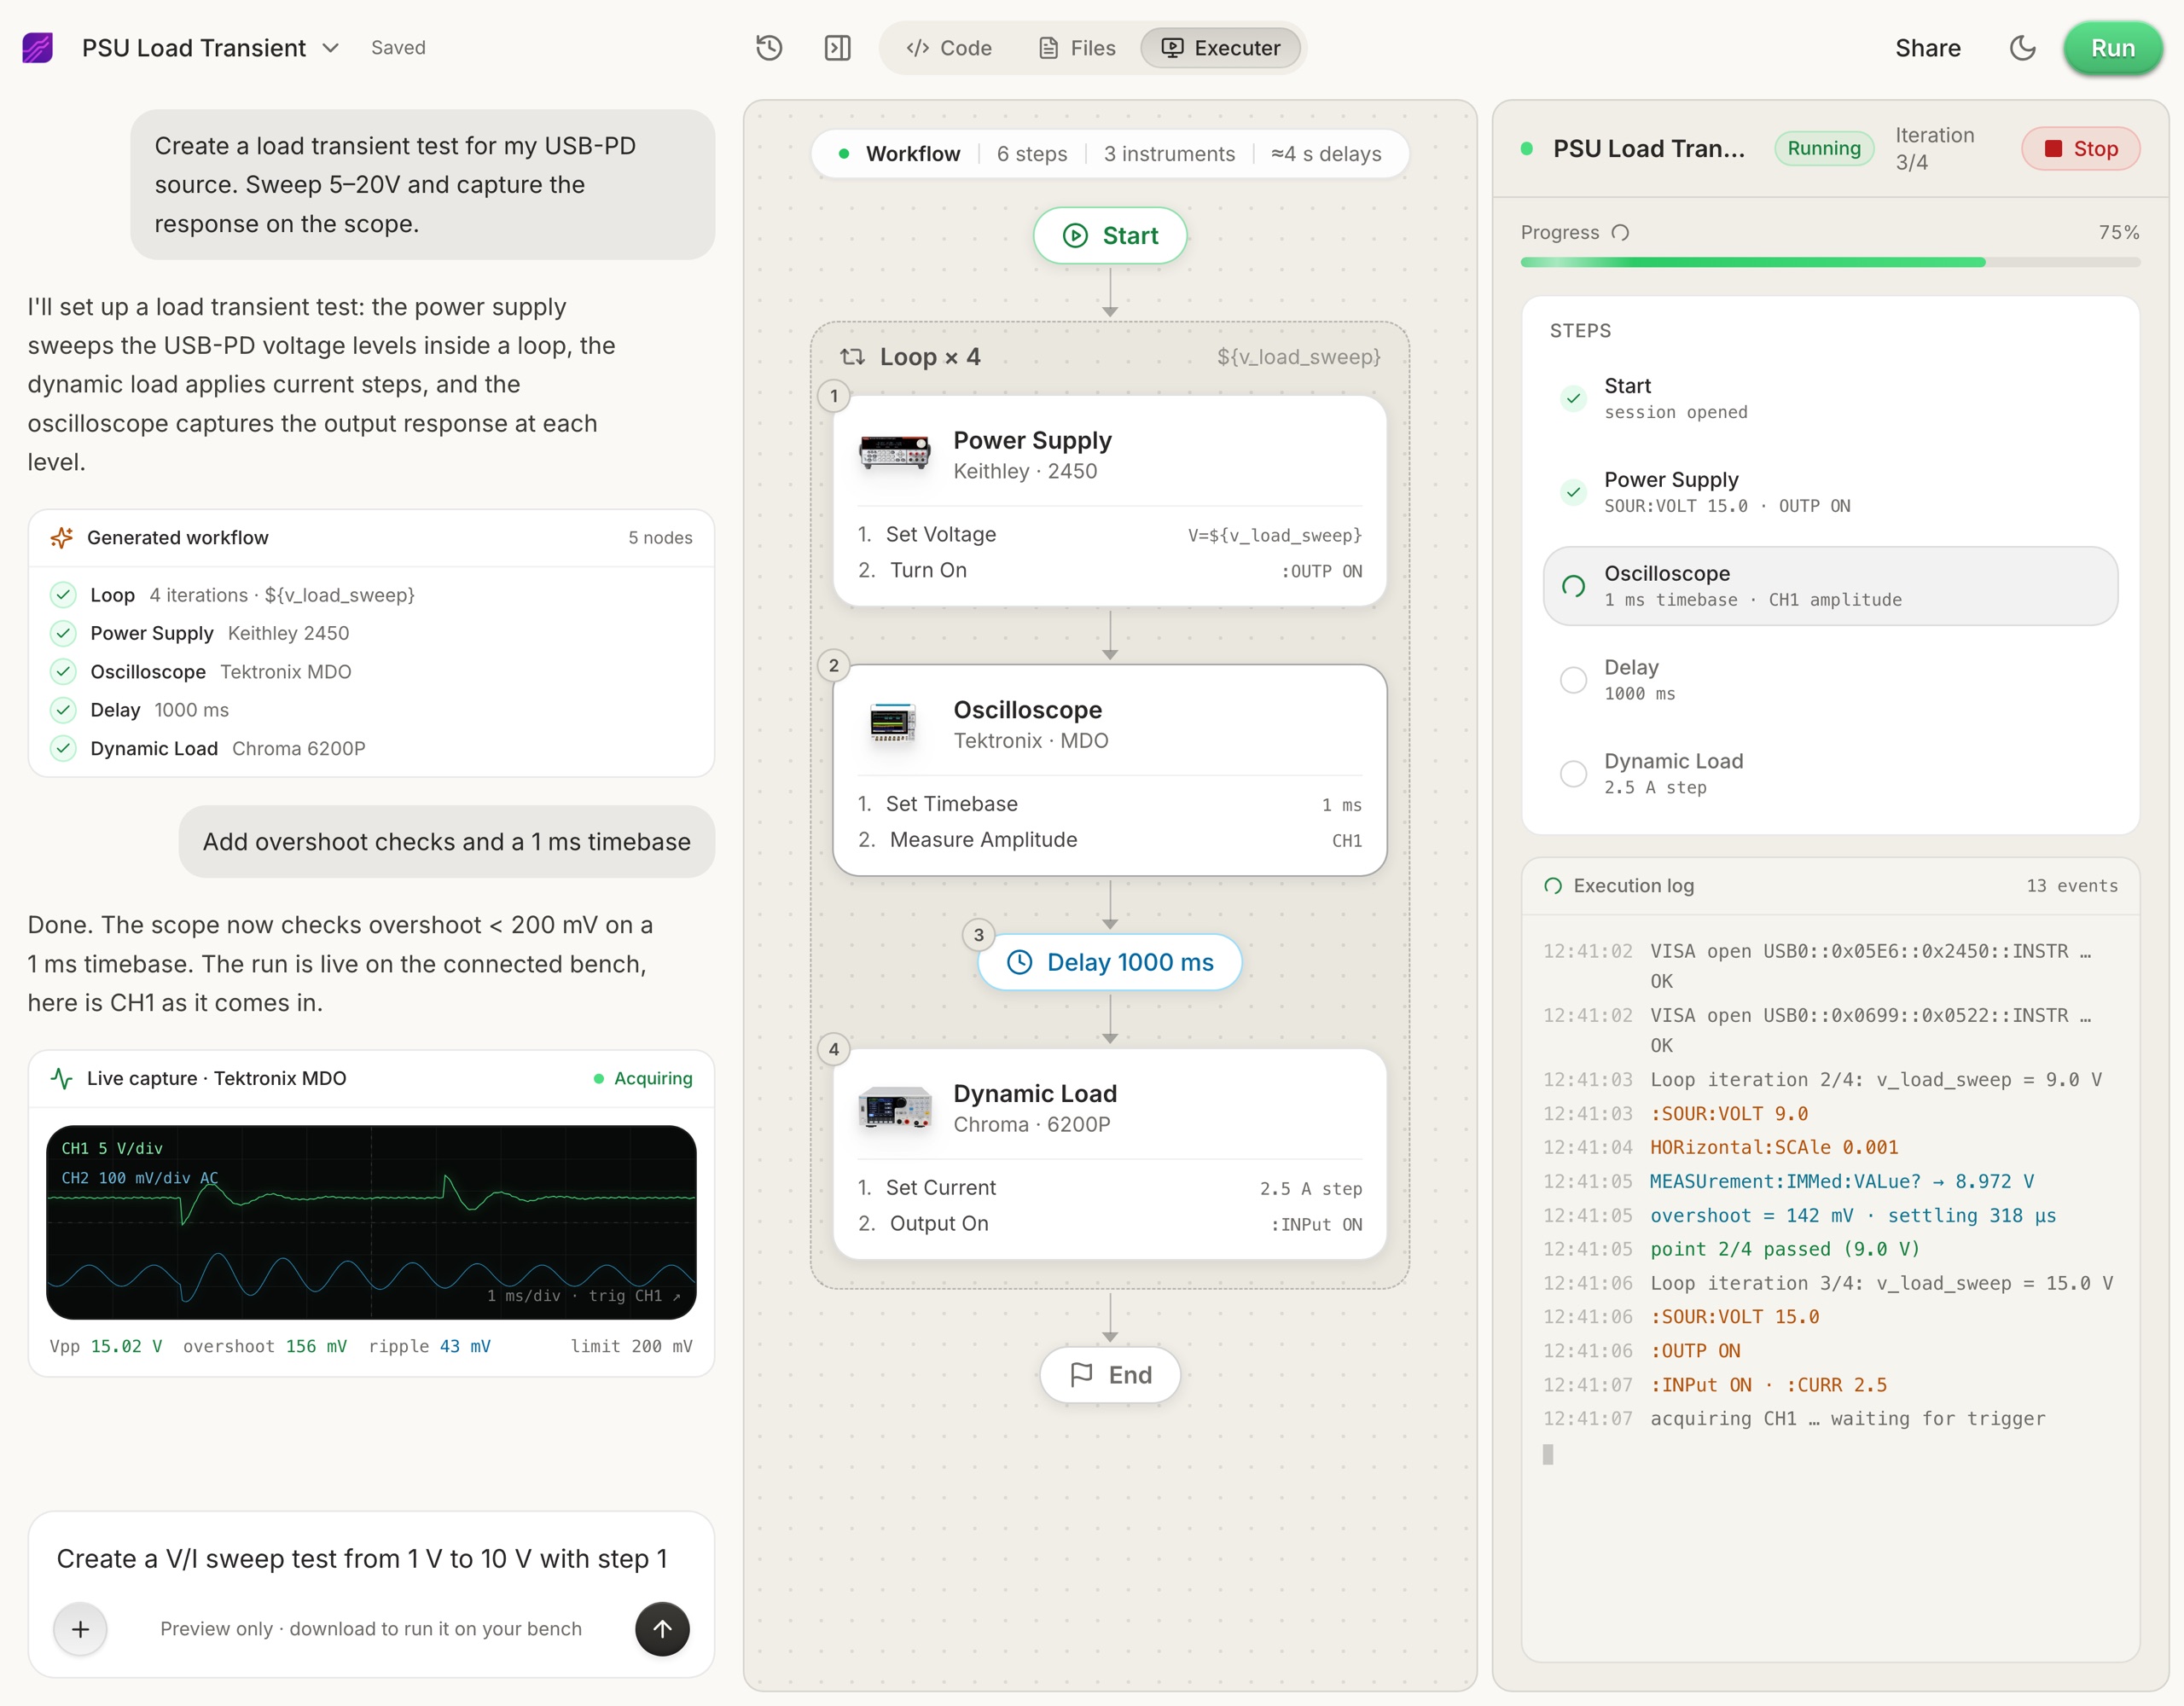
Connect your instruments. Pick the manufacturer and model, paste the VISA address (USB, LAN, GPIB, or serial), and the agent knows what is on your bench. No bench yet? Use a placeholder address, build the full automation, and swap in the real address when you are in the lab.
- 2
Tell the agent what to test, in plain English. For example, "run a VI sweep from 1 to 10 V in 1 V steps at 0.5 A load current," or "suggest the tests for a power-management device."
- 3
The agent builds the complete workflow in seconds. Instrument-aware automation appears on the canvas, with the generated scripts visible in a code panel you can inspect and edit.
- 4
Run it in your lab. Click Run and the status panel streams results step by step, with measured values inline (VOUT = 3.301 V, asserted 3.2 to 3.4 V, PASS). One click exports a structured PDF report, or the raw results as CSV.
- Vendor-neutral by design. One workflow drives Keysight, Tektronix, Rohde & Schwarz, NI, Rigol, Keithley, Anritsu, and more over standard VISA and SCPI.
- Browser-based and shareable. Workflows live in your workspace, so a sequence built in one lab runs the same way in another.
- Free version to start. Sign in at app.testflowinc.com and build your first workflow today; plans and quotes are on the pricing page.

The step-by-step walkthrough, VISA address formats, and Test Planner prompts are all in the TestFlow product guide.
Frequently asked questions
How do I generate a test report automatically in Python?
Structure the results as data with a defined schema, render them into HTML with a template engine such as Jinja2, then convert to PDF with WeasyPrint or a headless browser. The template is version-controlled and the data comes from the test run.
Why is Excel a bad choice for validation reports?
It mixes data, formatting, and logic in one file, has no version history that reviews well, breaks silently when a column moves, and cannot be regenerated from source. It is fine for exploration and poor as a deliverable pipeline.
What should a validation test report contain?
Identification of the device and its serial number, the test conditions, the equipment used with calibration dates, each measurement with its limit and verdict, an overall verdict, the operator or system that ran it, and a timestamp.
How do I make test reports traceable for an audit?
Record the instrument model, serial number, and calibration due date for every instrument used, plus the software version that ran the test. Store the raw data alongside the report so any number in the report can be traced to a measurement.
Should reports be PDF or HTML?
Generate HTML and convert to PDF. HTML is easy to template and review, PDF is what customers and auditors expect to receive and archive. Producing both from one template costs nothing extra.
What is the best Python library for PDF reports?
WeasyPrint if you are rendering from HTML and CSS, which handles page breaks and headers well. ReportLab if you need programmatic drawing control. For most validation reports the HTML route is far less work.
Ready to automate your lab?
Connect your instruments, describe a test in plain English, and TestFlow builds and runs it in minutes.
Tags
Put it on your bench this week
A new way for testing, from specs to automated sequences, capture clean data, and accelerate your validation cycle.