 Ali Kamaly
NI DIAdem Alternatives in 2026 (Free & Python-Based Options)
DIAdem is a report and analysis tool that costs four figures a seat. Here is what it does, which alternatives read TDMS files, and how to move your report templates without losing history.
NI DIAdem is a desktop application for loading, analysing, and reporting on measurement data, built around the TDMS file format and aimed at engineers who need to turn large test datasets into a repeatable document. It is the reporting half of the NI stack, sold separately from LabVIEW.
It is also a per-seat subscription that many teams renew out of habit, mostly to run report templates that were built years ago by someone who has since left. This post covers what DIAdem is genuinely good at, the five alternatives worth evaluating, and how to move your reports without stranding your history.
What DIAdem is actually good at
Three things, and they are real.
- •TDMS at scale. DIAdem opens files with thousands of channels and tens of millions of samples and stays responsive. Loading the same file into a naive pandas script will exhaust memory on a laptop. DIAdem's data portal and lazy loading are genuinely engineered for this.
- •Repeatable report templates. You build a layout once, point it at a new dataset, and get the same document. For teams that ship a standard validation report to a customer every week, this is the whole value.
- •Interactive browsing. Dragging channels onto a plot to see what happened during a five-hour soak test is fast and pleasant. Most alternatives make you write code to see anything.
If your workflow is "acquire with LabVIEW, analyse in DIAdem, send the PDF", DIAdem is doing more work than it looks like from the outside.
Where it stops making sense
- •The template is a black box. The person who built it has left. Nobody wants to change it. The report gets worse every year because editing it is scary.
- •One seat, one bottleneck. DIAdem is per-seat and desktop. The engineer with the licence becomes the reporting department.
- •It is a separate step. Data comes out of the test, then a human opens DIAdem, then a report exists. The gap between run and report is measured in days.
- •Cost stacks on cost. DIAdem sits on top of LabVIEW pricing, on top of hardware, on top of TestStand if you sequence. Nobody budgets the stack, they budget the pieces.
What DIAdem costs
Sold per seat, on subscription, in tiers.
| Tier | What it adds | Typical order of magnitude |
|---|---|---|
| Base | Load, view, basic analysis, reporting | Low four figures per seat per year |
| Advanced | Extended analysis library, scripting | Mid four figures per seat per year |
| Professional | Full analysis, advanced scripting, DataFinder | Upper four figures per seat per year |
| DataFinder Server | Multi-user indexed search across datasets | Quote-based, five figures |
Prices vary by region and by contract, and NI does not publish a universal list. Get the number in writing, and get it for the tier you actually use, which is usually lower than the one you were sold.
The alternatives
1. Python with pandas and npTDMS
Free. npTDMS reads TDMS directly into NumPy arrays or pandas DataFrames with no NI software installed. Add matplotlib or plotly for plots and reportlab or WeasyPrint for PDFs.
from nptdms import TdmsFile
import pandas as pd

tdms = TdmsFile.read("soak_test_2026_08.tdms")
df = tdms["Measurements"].as_dataframe()

summary = df.describe().T[["mean", "min", "max", "std"]]
failures = df[(df["VOUT"] < 3.2) | (df["VOUT"] > 3.4)]
print(f"{len(failures)} of {len(df)} samples outside limits")
Good for: anything you can express as code, and everything you want in version control. The analysis becomes reviewable, diffable, and runnable in CI.
Gives up: the interactive browsing, and the memory management. For very large files use TdmsFile.open() for streaming rather than read(), or you will hit the same wall that made DIAdem worth buying.
Verdict: the default answer for teams with any Python capability. See DAQ with Python for the acquisition side of the same stack.
2. TestFlow
Removes the stage rather than replacing the tool. The test run produces the structured report directly: measured values against limits, pass and fail per step, and a PDF or CSV export, with no separate analysis application and no template to maintain.
Good for: the common case where DIAdem exists only to turn a completed run into a document that says what passed.
Gives up: deep offline analysis of historical datasets. If your job is exploring five years of archived TDMS files looking for a trend, that is a data analysis problem and Python is the better answer.
Verdict: the right answer when the report is a byproduct of testing. The wrong answer when analysis is the product.
3. Grafana
Free and open source, with paid cloud tiers. Time-series dashboards backed by InfluxDB, TimescaleDB, or Postgres.
Good for: continuous monitoring, long-running soak and reliability tests, and letting the whole team see live results without a licence each.
Gives up: document-style reporting. Grafana produces dashboards, not the formatted PDF a customer signs off. Its PDF export is a screenshot of a dashboard, not a report.
Verdict: excellent complement, poor replacement. Use it alongside something that produces documents.
4. MATLAB
Reads TDMS through the Data Acquisition Toolbox, and its analysis library is deeper than DIAdem's in signal processing and statistics. Report Generator produces formatted documents.
Good for: teams that already own MATLAB and do maths-heavy analysis. If you are fitting models or doing frequency-domain work, this is the strongest analysis option on the list.
Gives up: nothing technical, but it is another commercial licence. Swapping one four-figure seat for another is not a saving unless the seat already exists.
Verdict: obvious choice if MATLAB is already in the building. See MATLAB vs LabVIEW for the wider comparison.
5. OriginLab Origin
Scientific plotting and analysis, strong on publication-quality graphics and batch processing of many files against one template.
Good for: the specific DIAdem use case of "same template, new dataset, every week". Origin's batch processing does this well and its plots look better.
Gives up: TDMS is not native. You will be exporting to CSV or writing an import filter, which adds a step to every run.
Verdict: worth a look if reports are the whole job and the data arrives as CSV anyway.
Comparison table
| DIAdem | Python | Grafana | MATLAB | Origin | TestFlow | |
|---|---|---|---|---|---|---|
| Cost | Four figures/seat/yr | Free | Free tier | Four figures/seat/yr | Four figures/seat | Free version, then paid |
| Reads TDMS natively | Yes | Yes (npTDMS) | No | Yes (toolbox) | No | Not needed |
| Formatted PDF report | Yes | With libraries | Weak | Yes | Yes | Built in |
| Interactive browsing | Excellent | Weak | Good | Good | Good | Run view |
| Handles very large files | Excellent | With streaming | Via database | Good | Moderate | N/A |
| Version-controllable | No | Yes | Dashboards as code | Yes | No | Workflows stored |
| Multi-user | Per seat | Unlimited | Yes | Per seat | Per seat | Workspace |
How to migrate without losing your history
The fear that keeps DIAdem renewals going is that old data becomes unreadable. It does not. TDMS is a documented format with multiple independent readers. Prove that first and the rest is straightforward.
- 1
Prove file access without DIAdem. Take your three largest historical TDMS files and open them with
npTDMS. Check the channel count, the sample count, and a known value against what DIAdem shows. This takes an afternoon and removes the entire objection. - 2
Inventory the templates. Most teams have between two and five report templates that matter and a dozen nobody runs. Only the live ones need porting.
- 3
Port one template, output side by side. Same input file, DIAdem report and new report next to each other. Check the numbers agree before you check the layout looks nice.
- 4
Move new tests first, archive second. New runs go through the new path. Historical analysis stays on DIAdem until the last renewal, then moves to Python.
- 5
Keep one read-only seat if the contract allows, for the archive, for one cycle. Cheaper than a rushed migration.
What a Python replacement actually looks like
The objection to leaving DIAdem is usually "we would have to rebuild the report". Here is the shape of that rebuild, so it can be estimated rather than feared.
from nptdms import TdmsFile
import pandas as pd
from jinja2 import Template
from weasyprint import HTML

def build_report(tdms_path: str, out_pdf: str, limits: dict):
    tdms = TdmsFile.read(tdms_path)
    df = tdms["Measurements"].as_dataframe()

    rows = []
    for channel, (lo, hi) in limits.items():
        series = df[channel]
        failures = int(((series < lo) | (series > hi)).sum())
        rows.append({
            "channel": channel, "min": series.min(), "max": series.max(),
            "mean": series.mean(), "limit": f"{lo} to {hi}",
            "verdict": "PASS" if failures == 0 else f"FAIL ({failures} pts)",
        })

    html = Template(TEMPLATE).render(
        title=tdms.properties.get("name", "Validation report"),
        rows=rows,
    )
    HTML(string=html).write_pdf(out_pdf)
That is the whole architecture: read, summarise against limits, render. A first working version is an afternoon. Matching your existing template's layout exactly is another day or two.
The part worth keeping from DIAdem is the discipline of a fixed template, not the tool that enforces it.
Handling files that will not fit in memory
The one genuine advantage DIAdem has is large-file handling. Match it with streaming rather than loading:
with TdmsFile.open("huge_soak.tdms") as tdms:
    channel = tdms["Measurements"]["VOUT"]
    total = count = 0
    for chunk in channel.data_chunks():
        total += chunk[:].sum()
        count += len(chunk[:])
    print(f"mean over {count} samples: {total / count:.6f}")
TdmsFile.open() keeps the file on disk and yields chunks. This handles files larger than RAM, which is the case that sends people back to DIAdem when a naive read() fails.
What is actually inside a TDMS file
Worth knowing, because the whole migration risk assessment rests on it. TDMS is a binary format with three levels: file, group, and channel. Each level carries arbitrary key-value properties, and channels carry the raw samples plus a waveform start time and increment.
from nptdms import TdmsFile

tdms = TdmsFile.read("run_0412.tdms")
print(tdms.properties)                       # file-level: operator, DUT serial, date
for group in tdms.groups():
    print(group.name, len(group.channels()))
    for ch in group.channels():
        print("  ", ch.name, ch.dtype, len(ch), ch.properties.get("unit_string"))
Two practical consequences:
- 1
Your metadata survives. Operator, serial number, station ID, and units are properties on the file, group, or channel, and npTDMS reads all of them. Nothing is trapped in a proprietary sidecar.
- 2
The index file is disposable. The
.tdms_indexnext to your data is a rebuildable accelerator, not data. If it goes missing, readers regenerate it.
There is one real gotcha: TDMS files written by a crashed application can be left without a final index and with a partially written last segment. npTDMS handles this, but it reports a shorter channel than DIAdem might. If a spot check disagrees on sample count, check whether the run terminated cleanly before you conclude the reader is wrong.
Choosing between the alternatives
Answer in order and stop at the first "yes".
- 1
Is the report a byproduct of a test you are running now? Generate it from the run. There is no analysis stage to replace.
- 2
Is exploring archived data the actual job? Python with pandas and npTDMS. This is a data analysis problem, and code beats a GUI for it.
- 3
Do you need a live view during a multi-day run? Grafana, backed by a time-series database.
- 4
Is the analysis maths-heavy, with model fitting or frequency-domain work? MATLAB, if the seat already exists.
- 5
Is it strictly "same template, new file, every week", with CSV input? Origin does that specific job well.
Common mistakes when leaving DIAdem
- •Porting all the templates. Inventory first. Most teams find two or three that anyone actually runs, and a dozen that exist because nobody deleted them.
- •Loading the whole file with `read()`. This is the mistake that sends people back to DIAdem. Use
TdmsFile.open()and chunked reads for anything over a gigabyte. - •Checking the layout before the numbers. Get the values agreeing first. Layout is cosmetic and quick; a silent unit or scaling mismatch is neither.
- •Cancelling the licence before the archive is proven readable. Prove access on your three largest historical files first. It takes an afternoon and it is the entire risk.
- •Rebuilding the interactive browser. Nobody successfully clones DIAdem's data portal in matplotlib. If interactive exploration is a real daily need, keep one seat and move only the reporting.
- •Ignoring where the data comes from. If the acquisition side is also NI, the analysis migration is half a project. Read it alongside LabVIEW alternatives and NI software licensing costs so you price the whole stack once.
Related reading
- •NI DIAdem explained, the product overview
- •LabVIEW alternatives, the acquisition half of the stack
- •DAQ with Python, reading data without the NI toolchain
- •How to automate test reports, the wider reporting problem
- •NI TestStand alternatives, if sequencing is also in scope
- •NI software licensing costs, the full stack priced line by line
- •Data acquisition software compared, the tools upstream of the report
- •MATLAB vs LabVIEW, if MATLAB is the destination
- •pyVISA tutorial, the instrument side of a Python stack
- •LabVIEW pricing, the licence maths on the acquisition half
- •Free instrument control software, the zero-cost options in one place
- •NI VeriStand alternatives, if real-time is also on the renewal
- •LabVIEW vs Python, the same trade one layer up
- •Instrument control with VISA and SCPI, how the data gets logged in the first place
- •Test sequencer comparison, the layer between acquisition and reporting
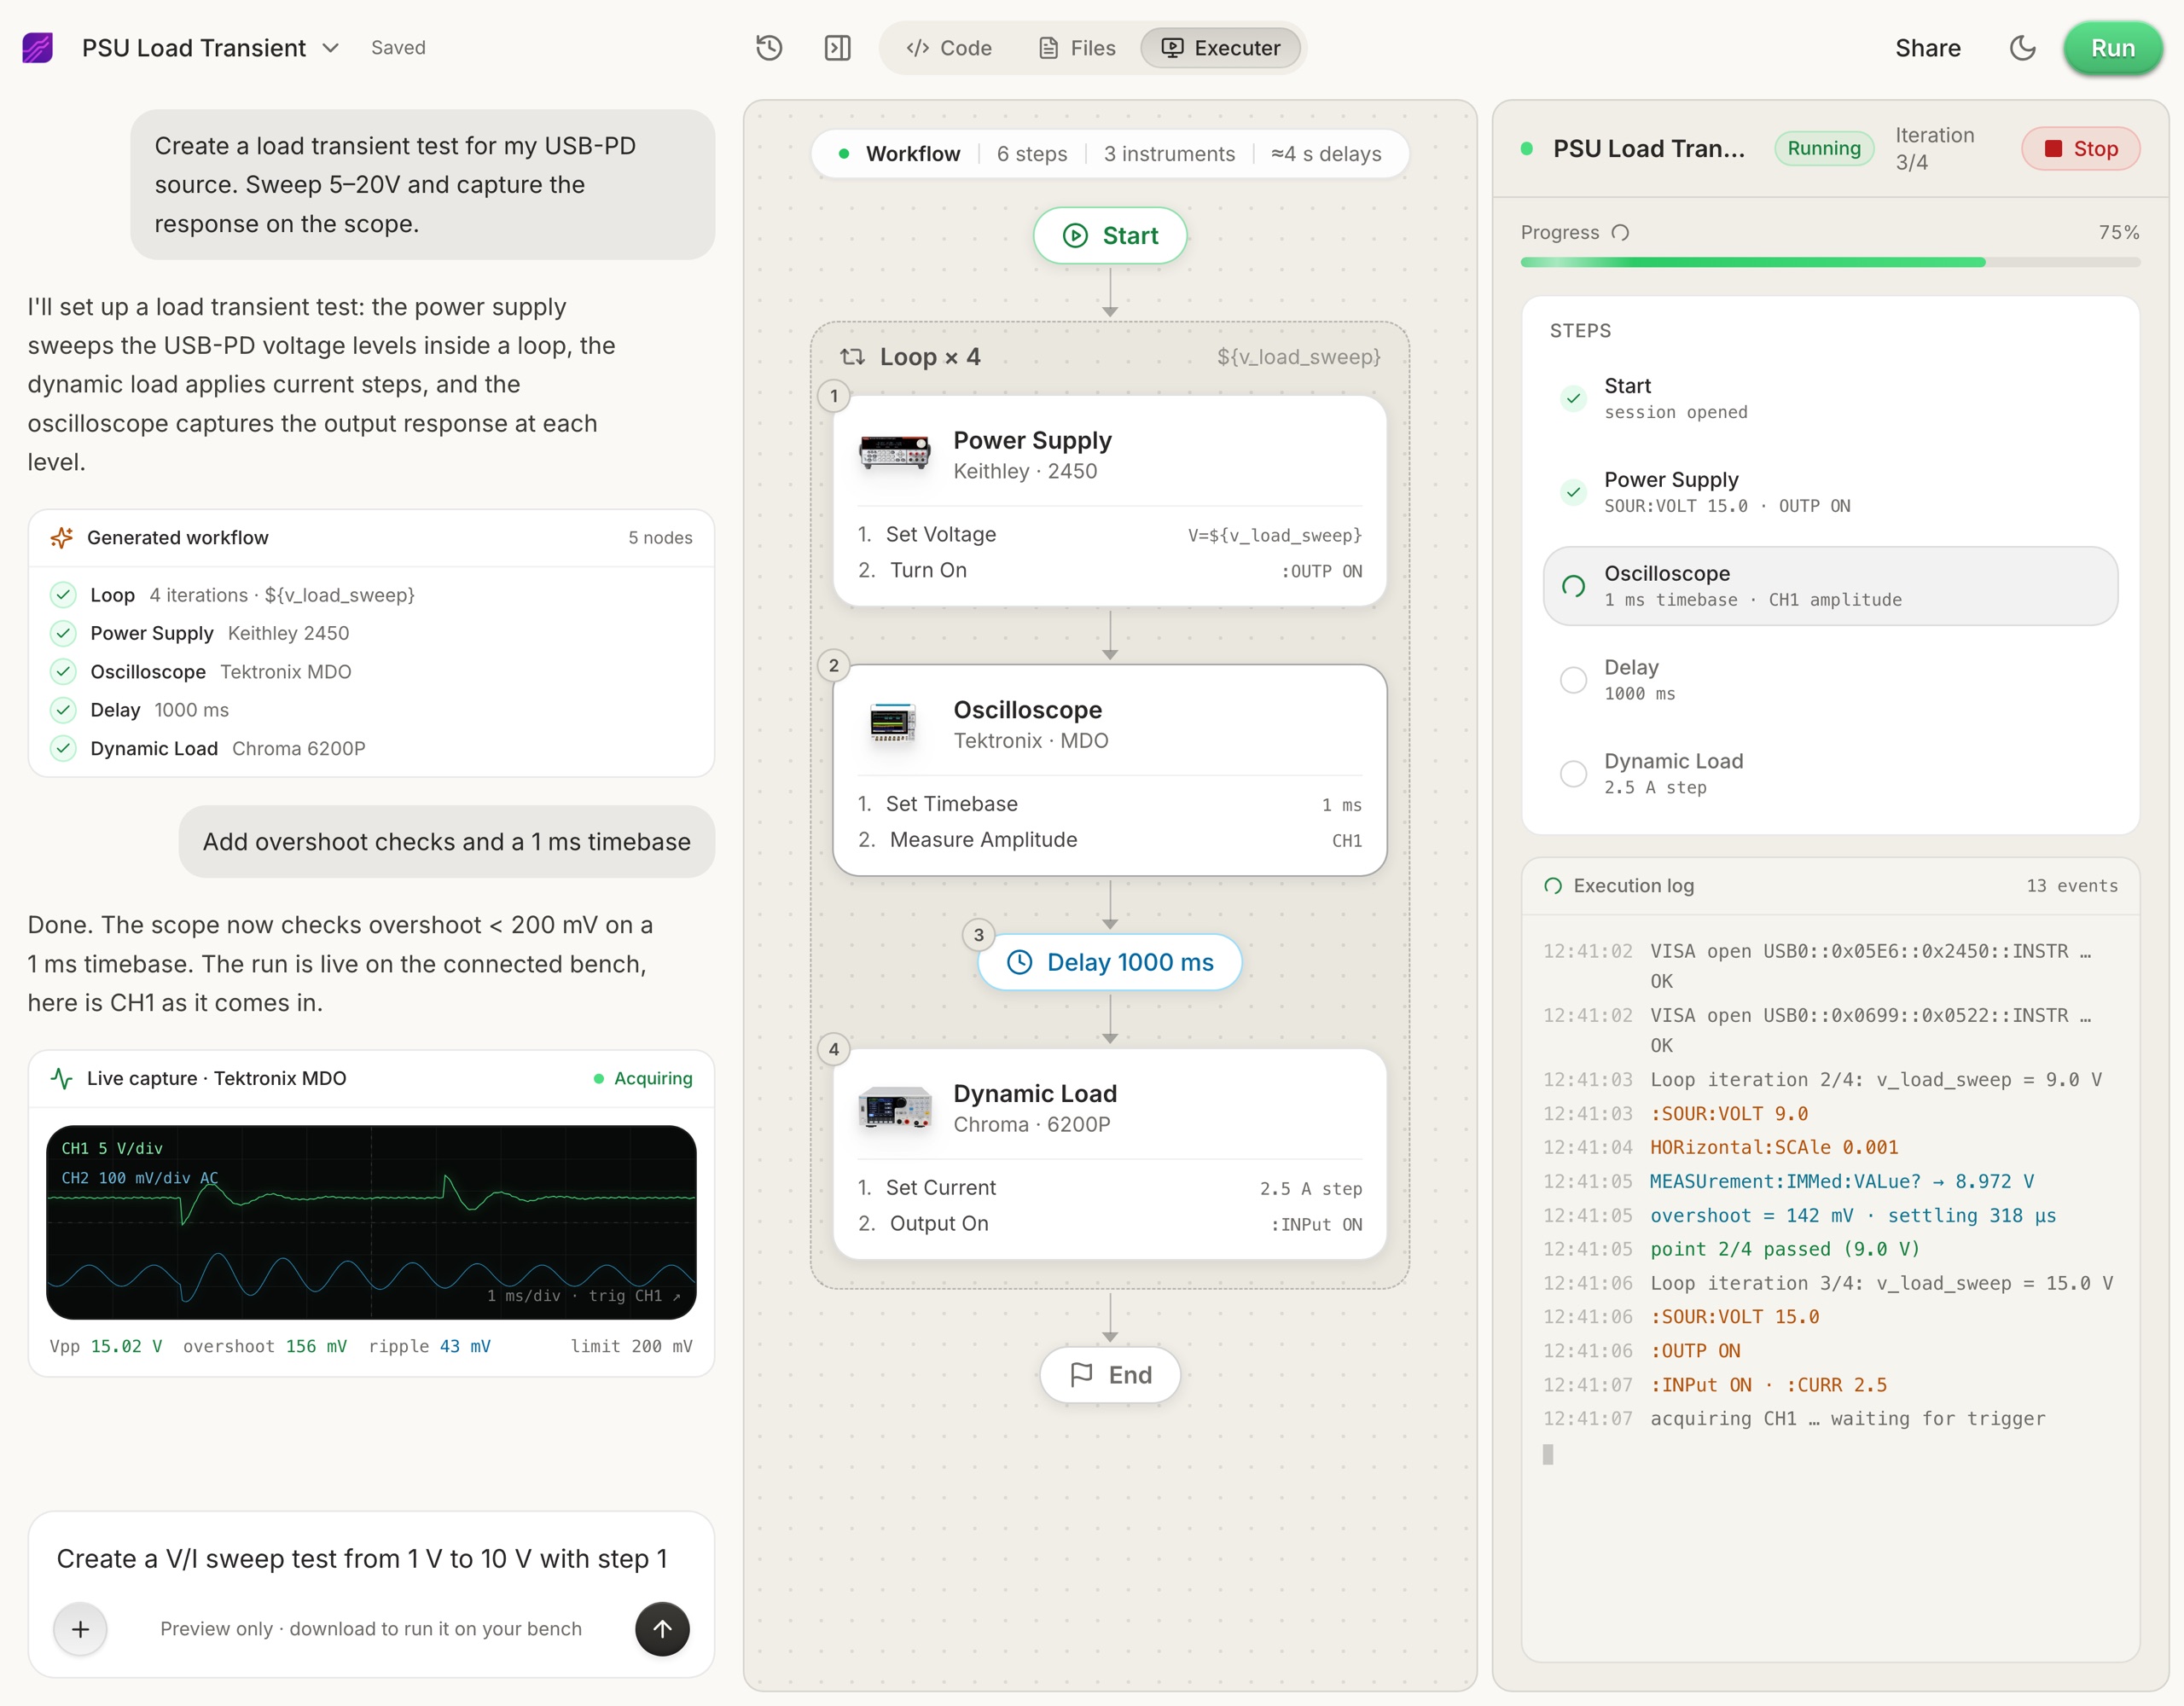
Where TestFlow fits
DIAdem sits downstream of the test, turning logged data into a document. TestFlow collapses that: the run produces the structured report directly, so there is no separate analysis and templating stage.
- 1
Connect your instruments. Pick the manufacturer and model, paste the VISA address (USB, LAN, GPIB, or serial), and the agent knows what is on your bench. No bench yet? Use a placeholder address, build the full automation, and swap in the real address when you are in the lab.
- 2
Tell the agent what to test, in plain English. For example, "run a VI sweep from 1 to 10 V in 1 V steps at 0.5 A load current," or "suggest the tests for a power-management device."
- 3
The agent builds the complete workflow in seconds. Instrument-aware automation appears on the canvas, with the generated scripts visible in a code panel you can inspect and edit.
- 4
Run it in your lab. Click Run and the status panel streams results step by step, with measured values inline (VOUT = 3.301 V, asserted 3.2 to 3.4 V, PASS). One click exports a structured PDF report, or the raw results as CSV.
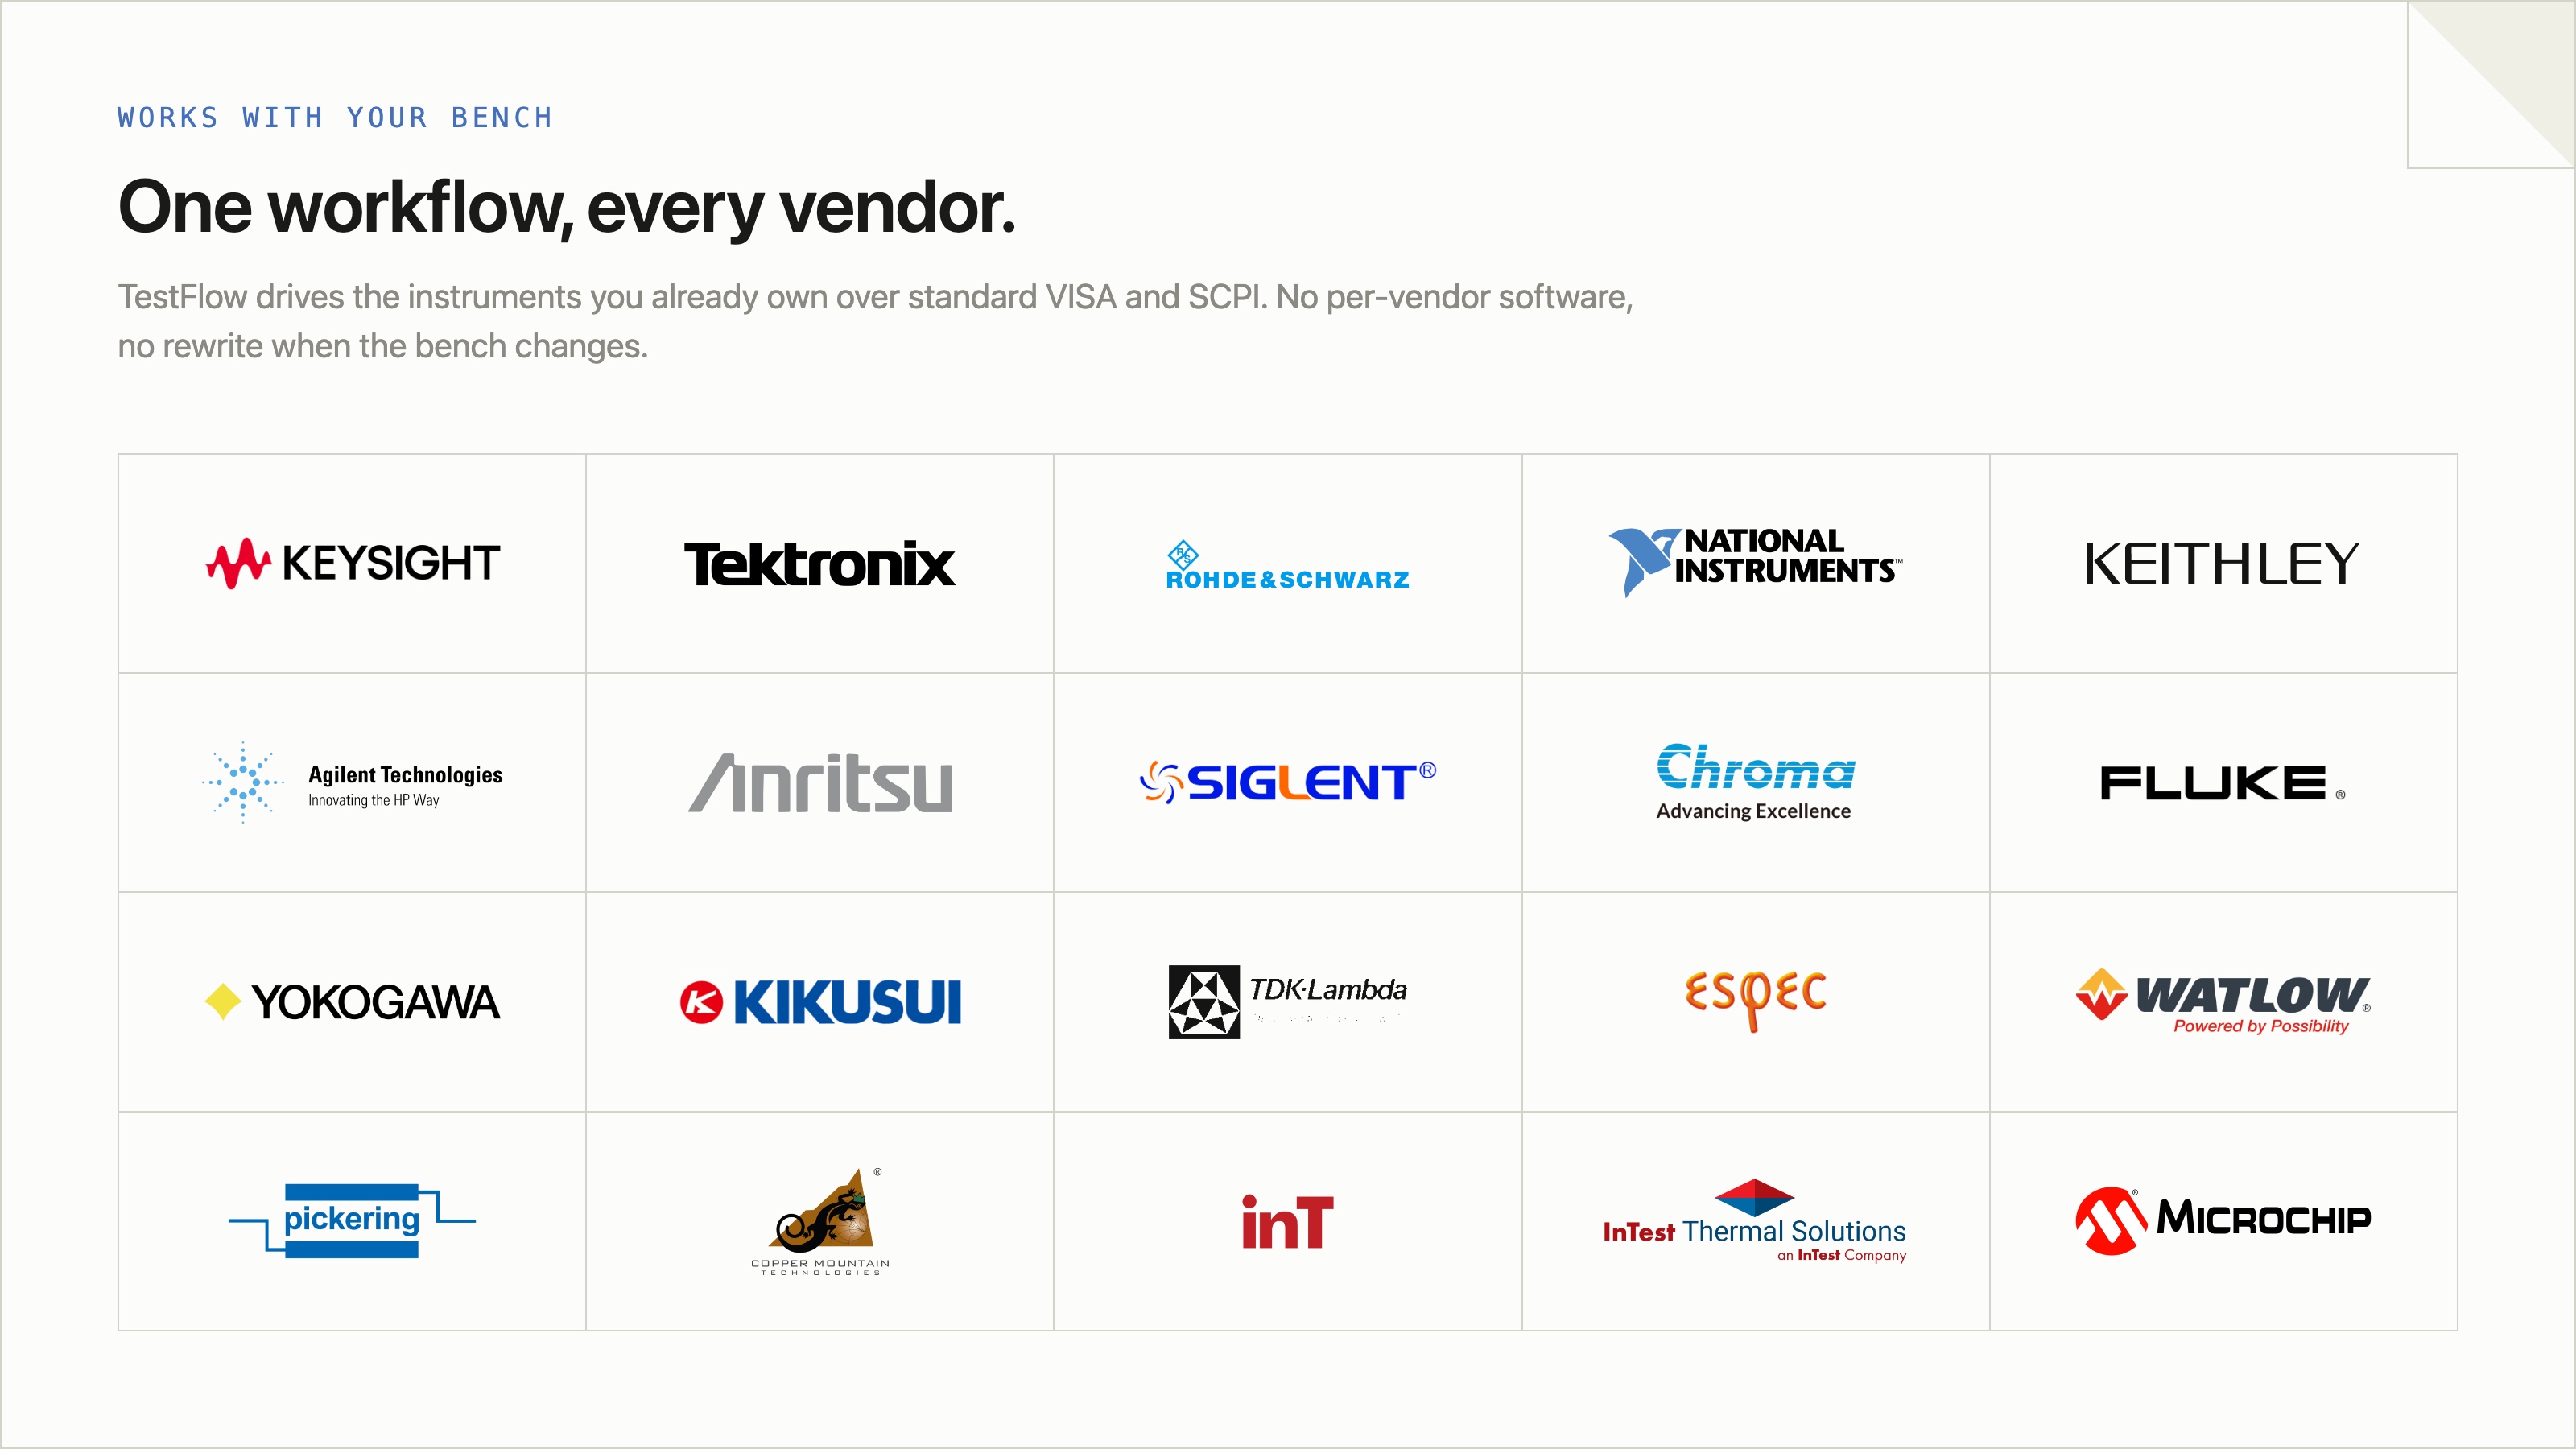
- Vendor-neutral by design. One workflow drives Keysight, Tektronix, Rohde & Schwarz, NI, Rigol, Keithley, Anritsu, and more over standard VISA and SCPI.
- Browser-based and shareable. Workflows live in your workspace, so a sequence built in one lab runs the same way in another.
- Free version to start. Sign in at app.testflowinc.com and build your first workflow today; plans and quotes are on the pricing page.
The step-by-step walkthrough, VISA address formats, and Test Planner prompts are all in the TestFlow product guide.
Frequently asked questions
What is NI DIAdem used for?
Loading, inspecting, analysing, and reporting on measurement data, especially large test datasets. It is strongest at handling TDMS files, building repeatable report templates, and letting engineers browse very large channel sets quickly.
Is there a free alternative to NI DIAdem?
Yes. Python with pandas and the npTDMS library reads TDMS files and does the analysis for free. Grafana covers dashboards, and TestFlow has a free version that generates the report as part of the test run.
How much does NI DIAdem cost?
DIAdem is sold per seat on subscription, typically low four figures per year for the base product, with the Advanced and Professional tiers costing more. Prices are region-dependent and quote-based, so confirm in writing.
Can Python read TDMS files?
Yes. The npTDMS library reads TDMS and TDMS index files directly into NumPy arrays or pandas DataFrames, with no NI software installed. It handles the file format including groups, channels, and properties.
What is the difference between DIAdem and LabVIEW?
LabVIEW acquires and controls. DIAdem analyses and reports on what was acquired. They are separate products with separate licences, which is why NI stack costs add up faster than people expect.
Can I still open my TDMS files if I stop paying for DIAdem?
Yes. TDMS is a documented format and npTDMS, MATLAB, and several other tools read it. Your historical data is not hostage to the licence, which is the main thing to establish before migrating.
Ready to automate your lab?
Connect your instruments, describe a test in plain English, and TestFlow builds and runs it in minutes.
Tags
Put it on your bench this week
A new way for testing, from specs to automated sequences, capture clean data, and accelerate your validation cycle.