 Ali Kamaly
Keysight Command Expert Alternatives 2026 (Free SCPI Tools)
Command Expert solves the SCPI discovery problem for Keysight hardware. Here are the alternatives for everything else, and the fastest way to find the right command for any instrument.
Keysight Command Expert is a free tool that solves SCPI discovery: connect an instrument, browse its command tree with documentation, run commands interactively, and export working code. It is genuinely useful and it is strongest on Keysight hardware.
For a mixed bench you need alternatives. This post covers five, and the discovery workflow that is faster than any of them.
The problem being solved
SCPI is standardised at the top of the command tree and vendor-specific below it. *IDN? works everywhere. The command to read a peak-to-peak voltage differs between every oscilloscope vendor, and sometimes between models from the same vendor.
So the actual daily question is never "what is SCPI", it is "what is the exact command string this specific instrument wants for this specific measurement". That is a lookup problem, and Command Expert is a good lookup tool.
The alternatives
1. NI-MAX VISA Test Panel
Free with NI drivers, which many labs already have installed.
Open Measurement and Automation Explorer, find the instrument under Devices and Interfaces, open the VISA Test Panel, and type commands into the Input/Output tab.
Good for: interactive testing of any VISA instrument regardless of brand. Confirming an instrument responds at all. Checking a command before putting it in a script.
Gives up: command set browsing and documentation. It sends what you type and shows what comes back, nothing more.
Verdict: the closest free equivalent for the interactive half, and vendor-neutral, which Command Expert is not.
2. Raw sockets over LAN
No software at all. Most LXI instruments listen on TCP port 5025 for raw SCPI.
nc 192.168.1.42 5025
*IDN?
Keysight Technologies,E36313A,MY59001234,1.0.5-1.0.3
MEAS:VOLT?
+3.30012000E+00
Or from Python with nothing but the standard library:
import socket

with socket.create_connection(("192.168.1.42", 5025), timeout=5) as s:
    s.sendall(b"*IDN?\n")
    print(s.recv(4096).decode().strip())
Good for: the fastest possible check that an instrument is alive and answering, with zero installation. Excellent for debugging when you suspect a VISA layer problem, because it bypasses VISA entirely.
Gives up: everything else. No discovery, no documentation, USB and GPIB not covered.
Verdict: the diagnostic tool of choice. When a PyVISA script misbehaves, dropping to a raw socket tells you in thirty seconds whether the problem is the instrument or your software stack.
3. The instrument's own web interface
Most LXI instruments serve a web page. Point a browser at the instrument's IP address.
Good for: confirming the IP and network settings, checking firmware version, and on many instruments there is a SCPI command console built into the page. Keysight and Tektronix both provide this on most LAN instruments.
Gives up: USB and GPIB instruments have no equivalent.
Verdict: underused. If an instrument is on LAN, the web interface is often the fastest route to a working command, with no installation and no drivers.
4. PyVISA interactive session
If you are automating in Python anyway, the REPL is a perfectly good discovery tool.
>>> import pyvisa
>>> rm = pyvisa.ResourceManager()
>>> inst = rm.open_resource("USB0::0x2A8D::0x1301::MY57200001::INSTR")
>>> inst.query("*IDN?")
'Keysight Technologies,34465A,MY57200001,A.03.02\n'
>>> inst.write("CONF:VOLT:DC 10")
>>> inst.query("READ?")
'+3.30014500E+00\n'
>>> inst.query("SYST:ERR?")
'+0,"No error"\n'
Good for: discovery in the same environment you will write the script in, so anything that works pastes straight across.
Gives up: documentation. You need the programming guide open beside it.
Verdict: what most engineers actually end up using. Pair it with the PDF. See the PyVISA tutorial.
5. The programming guide PDF
Not a tool, and it is the actual answer more often than any tool.
Every vendor publishes a programming guide per instrument family, typically several hundred pages, with every command, its parameters, its ranges, and examples.
The workflow that is faster than any software: open the PDF, search for the measurement name rather than the command. Searching "peak to peak" finds MEASUREMENT:IMMED:TYPE PK2PK in seconds. Searching the command tree structure does not.
Verdict: keep the PDF for every instrument on your bench in one folder. This single habit removes most SCPI discovery time.
Comparison table
| Command Expert | NI-MAX | Raw socket | Web interface | PyVISA REPL | Programming guide | |
|---|---|---|---|---|---|---|
| Cost | Free | Free | Free | Free | Free | Free |
| Command browsing | Yes, Keysight | No | No | Sometimes | No | Yes |
| Inline documentation | Yes, Keysight | No | No | Rarely | No | Complete |
| Interactive testing | Yes | Yes | Yes | Sometimes | Yes | No |
| Code export | Yes, several languages | No | No | No | Copy from REPL | Examples |
| Works with any vendor | Connect yes, browse no | Yes | LAN only | LAN only | Yes | Yes |
| Requires install | Yes | Yes | No | No | Yes | No |
| USB and GPIB | Yes | Yes | No | No | Yes | N/A |
The discovery workflow that works
Combining these rather than picking one:
- 1
Confirm the instrument answers.
*IDN?over a raw socket for LAN, or the NI-MAX test panel for USB and GPIB. If this fails, stop and fix the connection. - 2
Open the programming guide for that exact model. Search by measurement name.
- 3
Try the command interactively. PyVISA REPL or a test panel.
- 4
Check `SYST:ERR?` immediately.
-113,"Undefined header"means the command does not exist on this model, which usually means you found it in the wrong family's guide.-222,"Data out of range"means the command is right and the value is wrong. - 5
Paste into your script only after it works interactively.
Step 4 is the one that separates a five-minute problem from an afternoon. An instrument accepting a bad command silently and continuing is the default behaviour, and the error queue is the only place it tells you.
Why Command Expert is still worth installing
Even if your bench is mixed and you automate in Python, install it for the Keysight instruments.
The command set browser with inline documentation genuinely is faster than searching a PDF, and the code export produces a correct starting point rather than something you retype. For a Keysight-heavy bench it saves real time.
Use it for discovery on Keysight hardware, and the workflow above for everything else.
Building your own command reference as you go
The most useful artefact on a mature bench is not a tool, it is a file. Every time you find a working command, record it with the model it works on.
# scpi-notes.yaml
keysight_34465a:
  idn: "Keysight Technologies,34465A"
  dc_volts: "CONF:VOLT:DC {range},{resolution}"
  four_wire_res: "CONF:FRES {range},{resolution}"
  integration: "VOLT:DC:NPLC {nplc}"
  fast_mode_notes: "RANG:AUTO OFF and ZERO:AUTO OFF roughly double throughput"

tektronix_mso44:
  idn: "TEKTRONIX,MSO44"
  vpp: "MEASUREMENT:IMMED:TYPE PK2PK then MEASUREMENT:IMMED:VALUE?"
  binary_waveform: "DATA:ENC RIBINARY, DATA:WIDTH 2, then CURVE?"
  gotcha: "scaling needs YMULT, YOFF and YZERO applied to raw curve data"

rigol_dp832:
  idn: "RIGOL TECHNOLOGIES,DP832"
  channel_select: ":INST:NSEL {n}"
  gotcha: "colon prefix required, unlike the Keysight supplies"
This takes seconds per entry and compounds. After a year it is more useful than any vendor tool, because it contains exactly your instruments and, more importantly, the quirks you have already hit and would otherwise hit again.
Record the gotchas, not just the commands. The command is in the manual. The fact that this particular supply needs a colon prefix where the other one does not is the thing that costs an hour, and it is nowhere in any documentation.
Why discovery is the wrong problem to be good at
Worth stepping back. Every tool on this page makes finding a command faster, and the time actually spent is not mostly in finding commands.
For a typical new measurement, the breakdown is roughly:
| Activity | Share of the time |
|---|---|
| Finding the right SCPI commands | 10 to 20 percent |
| Working out the correct order and settling times | 25 to 35 percent |
| Handling errors, limits, and edge cases | 20 to 30 percent |
| Building the output and report | 20 to 30 percent |
Discovery is the smallest slice and the one with the most tools pointed at it, because it is the easiest to build a tool for. The larger slices, sequencing and settling and error handling, need knowledge of what the measurement is trying to establish rather than what the instrument accepts.
That is worth knowing before investing much effort in optimising the discovery step.
The four commands that solve most discovery problems
Before reaching for any tool, these four are in the SCPI standard and every compliant instrument answers them. They resolve a surprising share of "what does this instrument support" questions in about thirty seconds.
inst.query("*IDN?")        # manufacturer, model, serial, firmware
inst.query("*OPT?")        # installed options, the licensed capabilities
inst.query("SYST:ERR?")    # the last error, and why your command was ignored
inst.query("*STB?")        # status byte, is it busy or done
*OPT? is the underused one. Half of "this command does not work" turns out to be an unlicensed option rather than a syntax problem, and the option string tells you in one query. SYST:ERR? is the other: SCPI instruments do not raise, they queue an error and carry on, so a command that silently does nothing has almost always left an explanation sitting in that queue.
Make a habit of querying SYST:ERR? after every configuration block during development. It converts silent failures into readable messages, which is most of what a discovery tool was doing for you.
A small helper is worth writing once and reusing on every instrument:
def check(inst, context=""):
    """Drain the error queue and raise on anything that is not 'No error'."""
    problems = []
    while True:
        code, _, message = inst.query("SYST:ERR?").strip().partition(",")
        if code.strip() in ("0", "+0"):
            break
        problems.append(f"{code}{message}")
        if len(problems) > 20:                 # a stuck queue, stop draining
            break
    if problems:
        raise RuntimeError(f"{context}: " + "; ".join(problems))
Call it after each configuration block and the instrument tells you exactly which command it rejected, in its own words, at the point it happened rather than at the end of a failed run.
Reading a programming guide efficiently
The manual is the authority, and it is only slow if you read it linearly. The structure is near-identical across vendors.
| Section | What it gives you | Read it |
|---|---|---|
| Command tree diagram | The subsystem hierarchy at a glance | First, always |
| Command reference | Syntax, parameters, ranges, defaults | On demand |
| Programming examples | Working sequences for common tasks | Second |
| Status system chapter | Registers, *OPC, synchronisation | When timing goes wrong |
| Error message list | What a numeric error code means | When SYST:ERR? returns something |
Start with the tree diagram, find the subsystem, then jump to that entry. Two details in the reference save the most time: square brackets mean optional (:MEASure[:VOLTage][:DC]? is the same as :MEAS?), and the short form is the capitalised part (:SOURce:VOLTage can be written :SOUR:VOLT). Knowing those two conventions makes the reference skimmable instead of dense. The SCPI command cheat sheet collects the common patterns per instrument class.
Common mistakes
- •Not checking `SYST:ERR?`. The single most common cause of "the instrument ignores my command". The explanation is already queued.
- •Assuming a command exists because a sibling model has it. Firmware versions and installed options differ within the same series.
*IDN?and*OPT?first. - •Copying commands without the query form. Setting a value and never reading it back means you find out at the end of the run that it never applied.
- •Discovering interactively and never writing it down. The session is lost when the terminal closes. Keep a per-instrument notes file from the first day, as described above.
- •Forgetting the termination character. Over raw sockets you must send the newline yourself. VISA does it for you, which is why the same command works in one place and hangs in the other. See instrument control with VISA and SCPI.
- •Treating discovery as a permanent skill. It is a means to an end. The goal is a working sequence, not encyclopedic knowledge of one vendor's command tree.
Related reading
- •Keysight IO Libraries, the VISA layer Command Expert sits on
- •SCPI command cheat sheet
- •PyVISA tutorial
- •Instrument control with VISA and SCPI
- •Free instrument control software
- •Keysight 34465A SCPI commands, a worked command reference
- •Automate a Keysight power supply with Python, discovery applied
- •Automate multimeter measurements with Python, the most common first script
- •GPIB vs USB vs LAN, why the transport changes the behaviour
- •Keysight PathWave alternatives, once discovery becomes a sequence
- •Keysight BenchVue alternative, the no-code route
- •Python instrument control libraries compared, what to build on
- •Keysight 33600A programming, another worked example
- •Keysight 34461A datasheet, reading the spec behind the commands
- •Test sequencer comparison, where the commands end up
- •NI TestStand alternatives, where discovered commands become a sequence
Where TestFlow fits
Every tool on this page helps you find a command faster. None of them tell you which commands, in which order, make a particular measurement work.
- 1
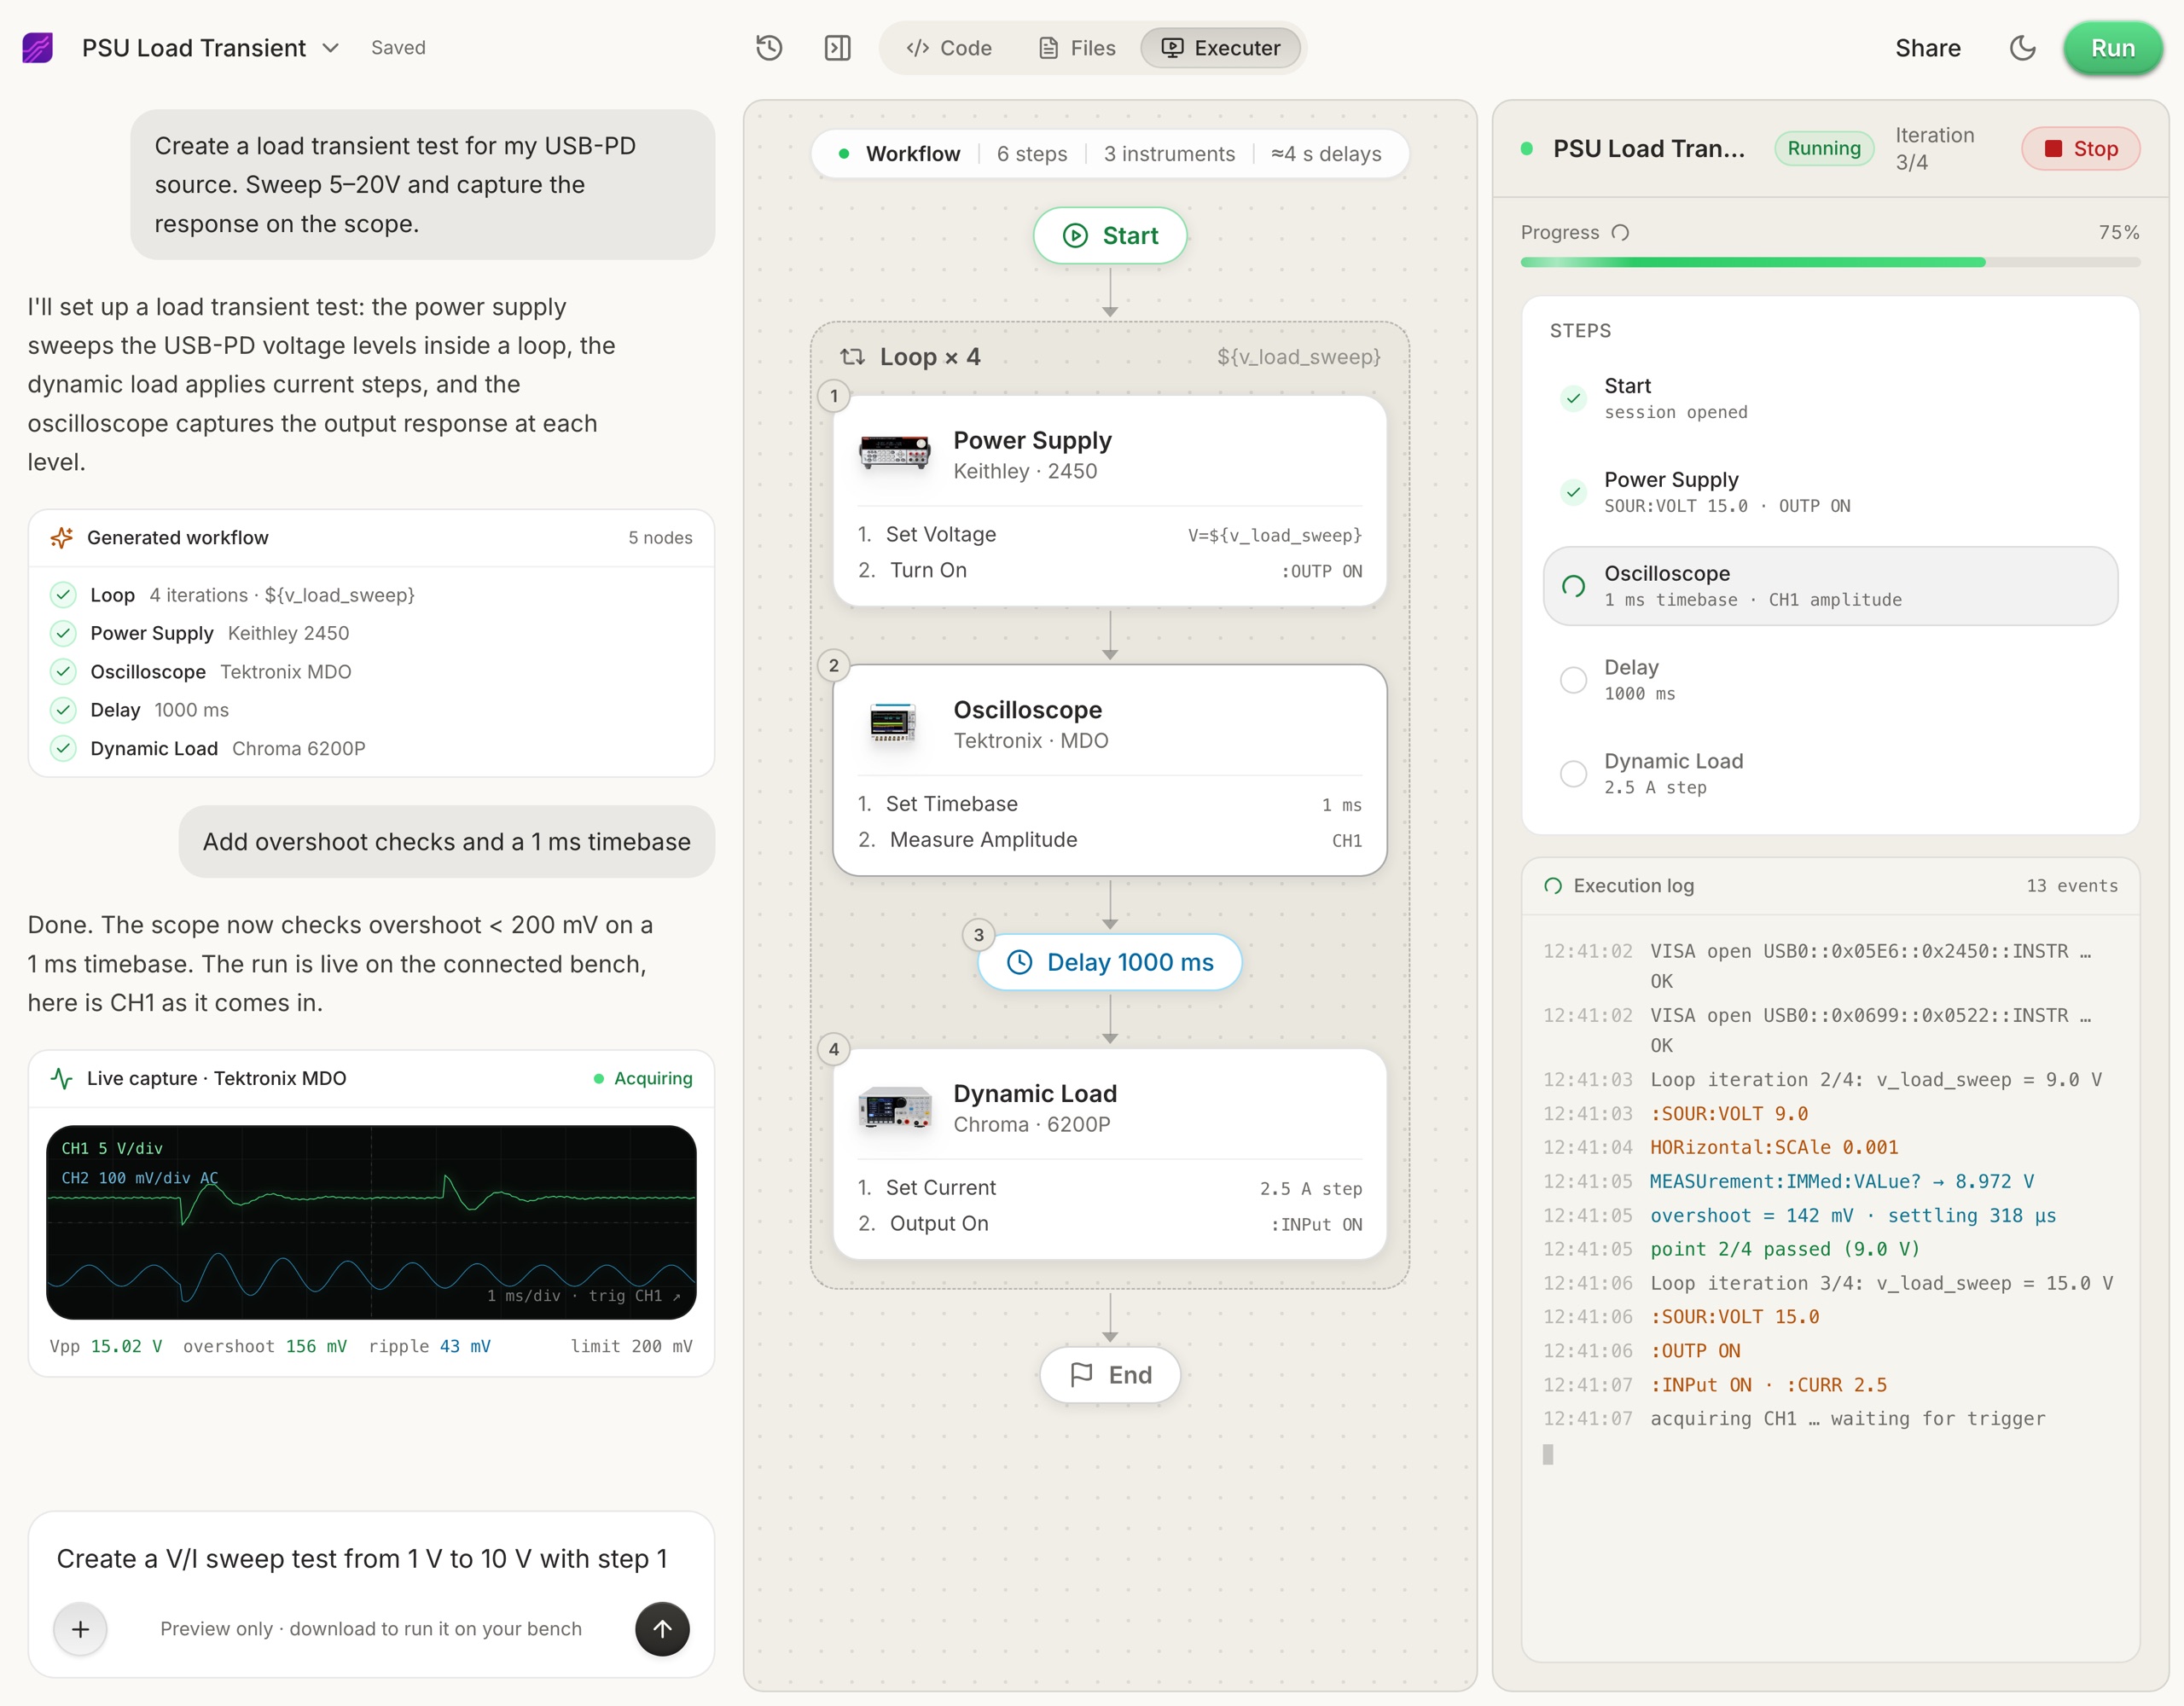
Connect your instruments. Pick the manufacturer and model, paste the VISA address (USB, LAN, GPIB, or serial), and the agent knows what is on your bench. No bench yet? Use a placeholder address, build the full automation, and swap in the real address when you are in the lab.
- 2
Tell the agent what to test, in plain English. For example, "run a VI sweep from 1 to 10 V in 1 V steps at 0.5 A load current," or "suggest the tests for a power-management device."
- 3
The agent builds the complete workflow in seconds. Instrument-aware automation appears on the canvas, with the generated scripts visible in a code panel you can inspect and edit.
- 4
Run it in your lab. Click Run and the status panel streams results step by step, with measured values inline (VOUT = 3.301 V, asserted 3.2 to 3.4 V, PASS). One click exports a structured PDF report, or the raw results as CSV.
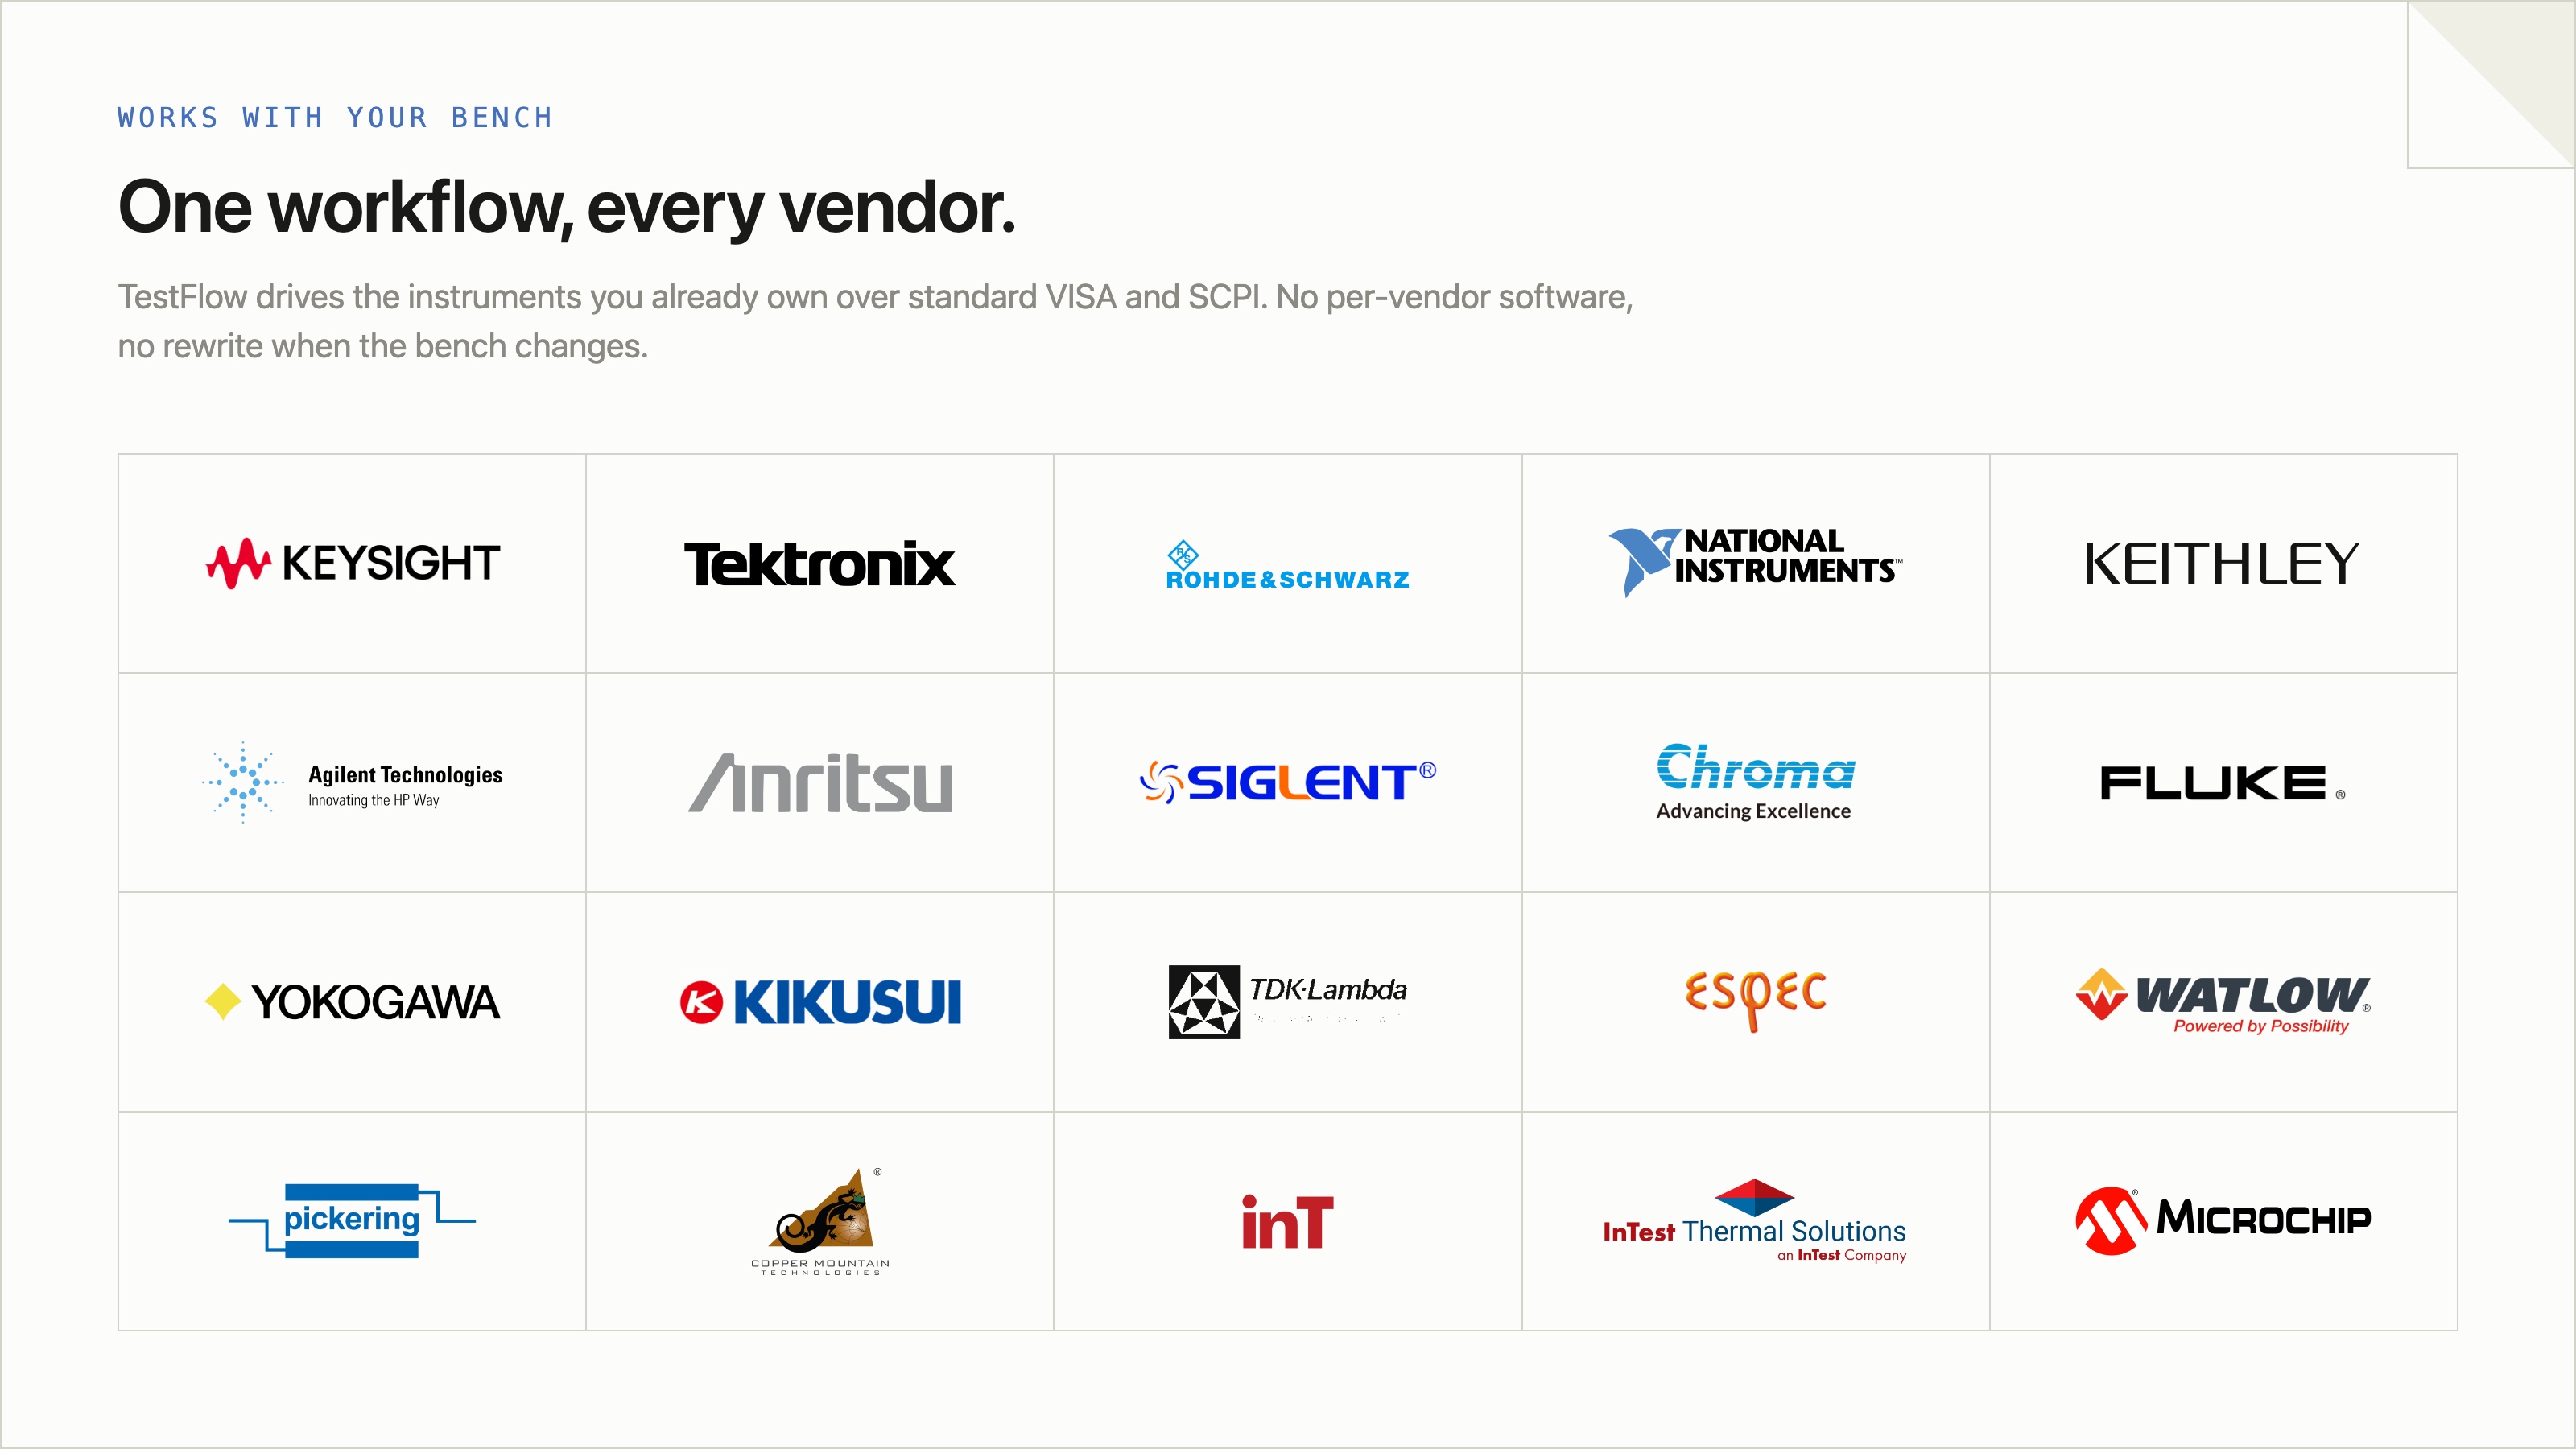
- Vendor-neutral by design. One workflow drives Keysight, Tektronix, Rohde & Schwarz, NI, Rigol, Keithley, Anritsu, and more over standard VISA and SCPI.
- Browser-based and shareable. Workflows live in your workspace, so a sequence built in one lab runs the same way in another.
- Free version to start. Sign in at app.testflowinc.com and build your first workflow today; plans and quotes are on the pricing page.
The step-by-step walkthrough, VISA address formats, and Test Planner prompts are all in the TestFlow product guide.
Frequently asked questions
What is Keysight Command Expert?
A free Keysight tool that connects to an instrument, browses its full SCPI command set with inline documentation, lets you run commands interactively, and exports working code in Python, C#, MATLAB, and other languages.
Is Keysight Command Expert free?
Yes, it is a free download with no licence key. It works best with Keysight instruments, where command sets are bundled, and supports other instruments over VISA with less documentation.
Does Command Expert work with non-Keysight instruments?
It can connect to and send commands to any VISA instrument, but the command set browsing and inline documentation are only available for instruments Keysight provides definitions for, which is mainly their own.
What is the fastest way to find the SCPI command I need?
The programming guide PDF for that exact model, searched for the measurement name. Generic SCPI references cover the standardised layer only, and most of what you need is below it in vendor-specific territory.
Can I test SCPI commands without any software?
Yes, for LAN instruments. Most listen on TCP port 5025 for raw SCPI, so a plain telnet or netcat session lets you type commands and see responses with nothing installed.
What is NI-MAX?
NI Measurement and Automation Explorer, a free tool bundled with NI drivers. Its VISA Test Panel lets you connect to any VISA instrument and send commands interactively, which covers the same interactive testing role.
Ready to automate your lab?
Connect your instruments, describe a test in plain English, and TestFlow builds and runs it in minutes.
Tags
Put it on your bench this week
A new way for testing, from specs to automated sequences, capture clean data, and accelerate your validation cycle.